Annual property taxes are a direct, out-of-pocket expense that affects budgets for homeowners in the U.S. Rising real estate taxes are having a negative impact on millions of homeowners as US home prices continue to grow and hit all-time highs. This is according to a new CoreLogic report, which examined just how much property taxes have changed since the pandemic.
Specifically, the significant increases in home prices during the pandemic were followed by the 2023 property-tax assessment cycle. The U.S. home market experienced one of the greatest price increases in history between 2019 and 2022, rising by almost 40%.
Property taxes can differ from state to state, as well as from county to municipality, and are determined by the assessed value of a home. However, as values increase over time, property taxes almost always rise.
Through an assessment cycle, local tax assessors reevaluate properties on a regular basis. State rules and norms regulate assessment cycles, while local decisions are frequently made in accordance with statutory provisions. As a result, property taxes will rise more frequently and assessed values will more accurately represent the property’s current market value the shorter assessment cycles that local tax officials use. In actuality, evaluation cycles could last anything from one year to ten years.
Homeowners who reside in states or tax jurisdictions where homes are subject to annual reassessments (or have recently been reassessed) as the 2023 assessment cycle draws to a close will probably notice a sharp increase in property taxes, especially in places where home prices increased significantly during the pandemic.
How Much Have Americans’ Property Taxes Changed Since the Pandemic?

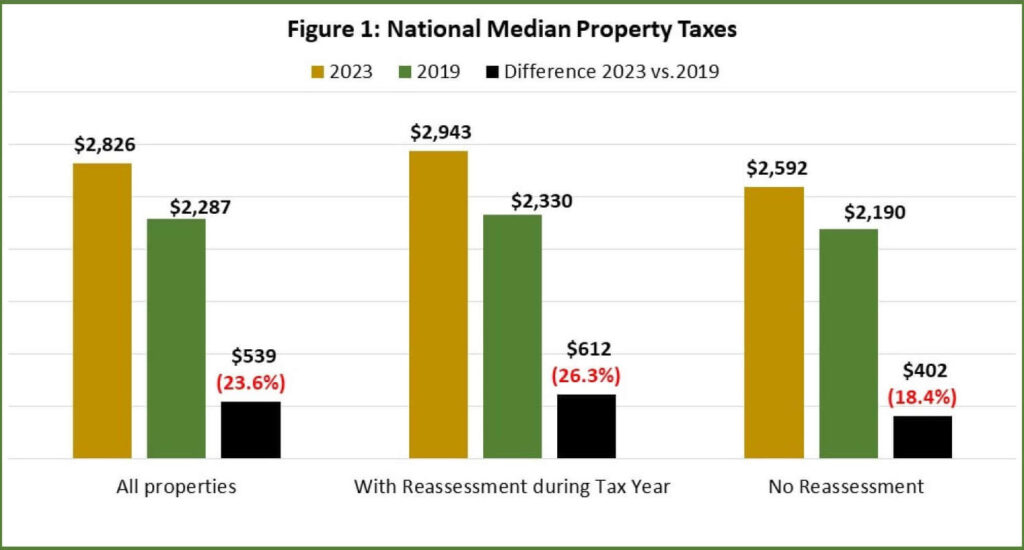
Whether or not there was a reassessment, the median property taxes in the U.S. for all properties reached $2,826 in 2023, an increase of $539 from 2019 and a 23.6% increase over that time, or 5.9% annually.
The typical property taxes for reassessed properties were $2,943 in 2023, an increase of $612, or 26.3%, from 2019—an average of 6.6% annually. As a result, homeowners whose homes were not reassessed paid $315 less in median property taxes, totaling $2,592. Additionally, there was a lower increase in non-reassessed properties between 2019 and 2023—402 or 18.4%, on average 5% annually.
Examining Annual Property Tax Rates and Costs by State

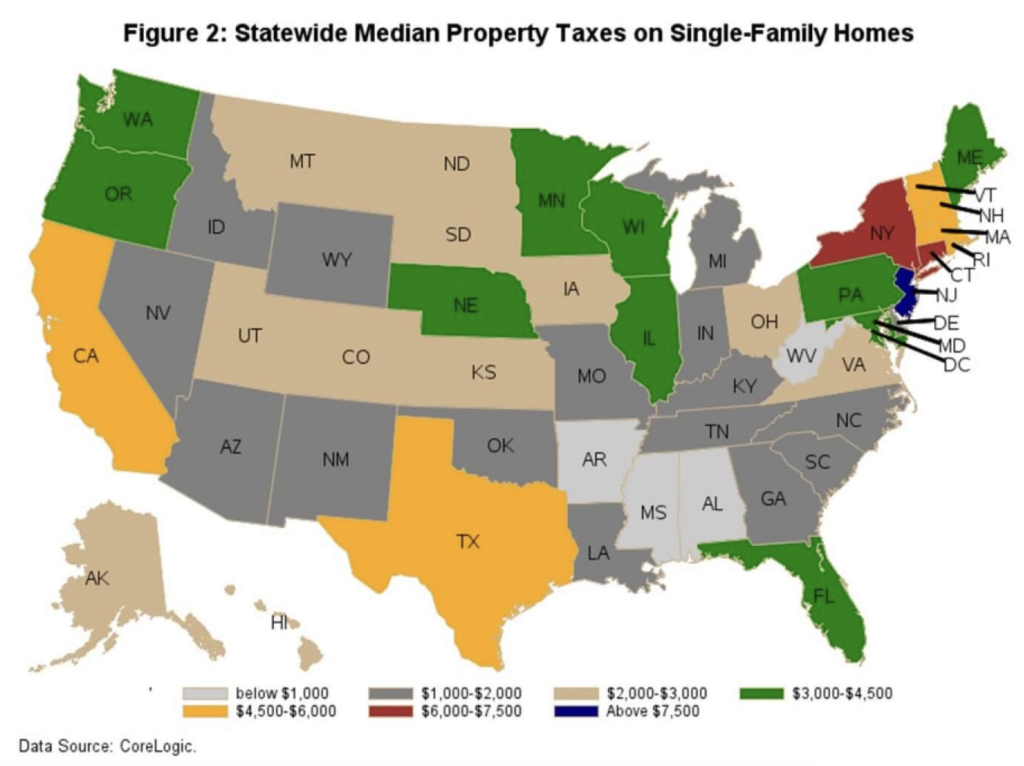
According to the analysis, property taxes differ vastly at the state level. In 2023, Mississippi ($896), Arkansas ($847), West Virginia ($694), and Alabama ($708) had the lowest median property taxes among the states. The states with the highest median property taxes were New Jersey ($8,498), Connecticut ($6,103), and New York ($6,043).
California, Texas, Vermont, New Hampshire, Rhode Island, and Massachusetts have the next highest property taxes, with median yearly payments ranging from $4,500 to $6,000.
The main cause of varying property taxes is the disparity in property tax rates and home prices. State regulations that set annual limits on assessment value rises are also significant because they influence the annual rate of growth in property taxes, independent of the market rate of appreciation of home prices.
For example, reassessment hikes are capped in California at 2%, but homeowners in Texas are subject to a 10% annual cap. Even though both Texas and California have had some of the greatest increases in home prices in recent years, many homeowners in Texas have probably seen their property taxes rise considerably more quickly than those in California due to Texas’s less stringent assessment cap.
Hawaii has property tax rates as low as 0.3%, while states like Illinois, Pennsylvania, New York, New Jersey, and Vermont have rates as high as 2% or higher. After a significant legislative tax decrease in 2023 that benefited homeowners with an average 18% drop in property taxes, Idaho has the second-lowest rate. Idaho’s median annual property taxes in 2023 were $1,718.
In conclusion, It’s critical to remember that the figures above are state averages. Property taxes are set and administered by local governments, counties, and municipalities in the United States, therefore the location of your purchase will affect the actual rate and yearly expenses.
To read the full report, including more data, charts, and methodology, click here.


