Although they’ve declined from their recent highs, U.S. home prices are still quite high, according to a new LendingTree study. Despite this, the percentage of people who own a home has increased recently.
More specifically, the percentage of owner-occupied houses in the 50 largest metropolitan areas in the country grew by 93 basis points between 2019 and 2022 and by 108 basis points between 2012 and 2022, per a LendingTree study of the most recent U.S. Census Bureau American Community Survey data.
Put differently, LendingTree research shows that more people have become homeowners even though some localities have seen a more than twofold increase in property values since 2012.
Key Findings:
- As of 2022, almost 43.5 million of the 70.4 million occupied housing units in the nation’s 50 largest metros were owner-occupied. The overall homeownership rate across these metros is 61.72%.
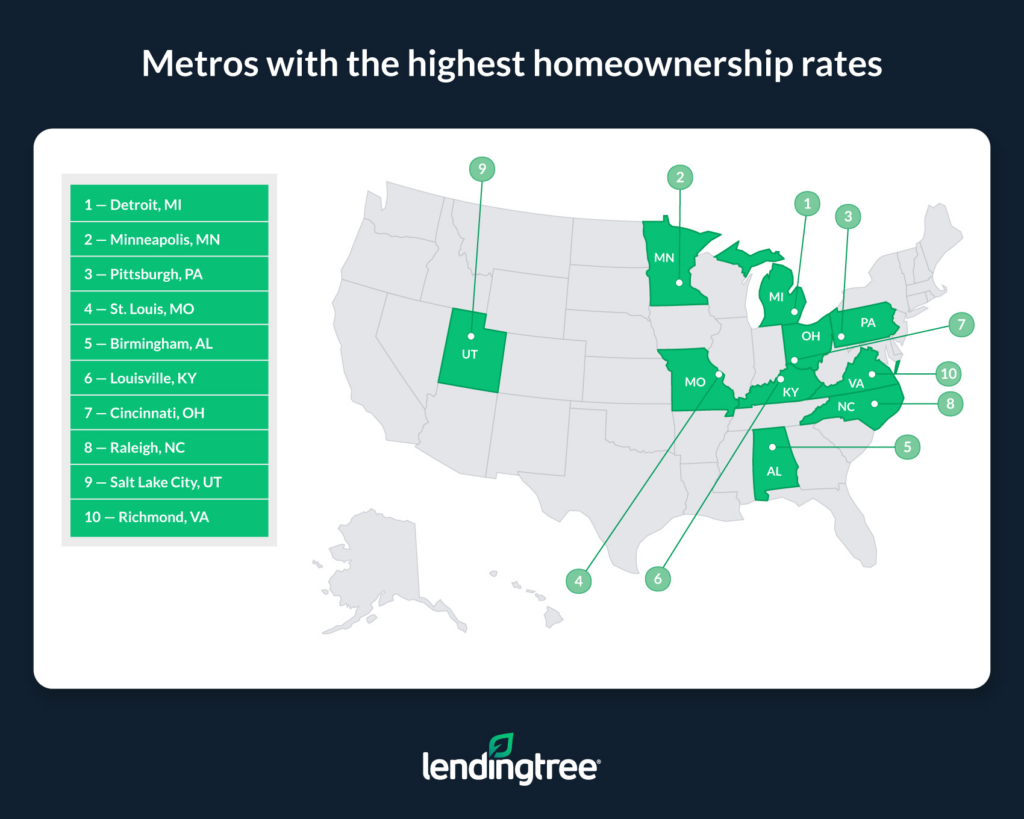
- Homeownership rates are highest in the Detroit, Minneapolis and Pittsburgh metros. The homeownership rates in these metros are 71.49%, 70.54% and 70.45%, respectively.
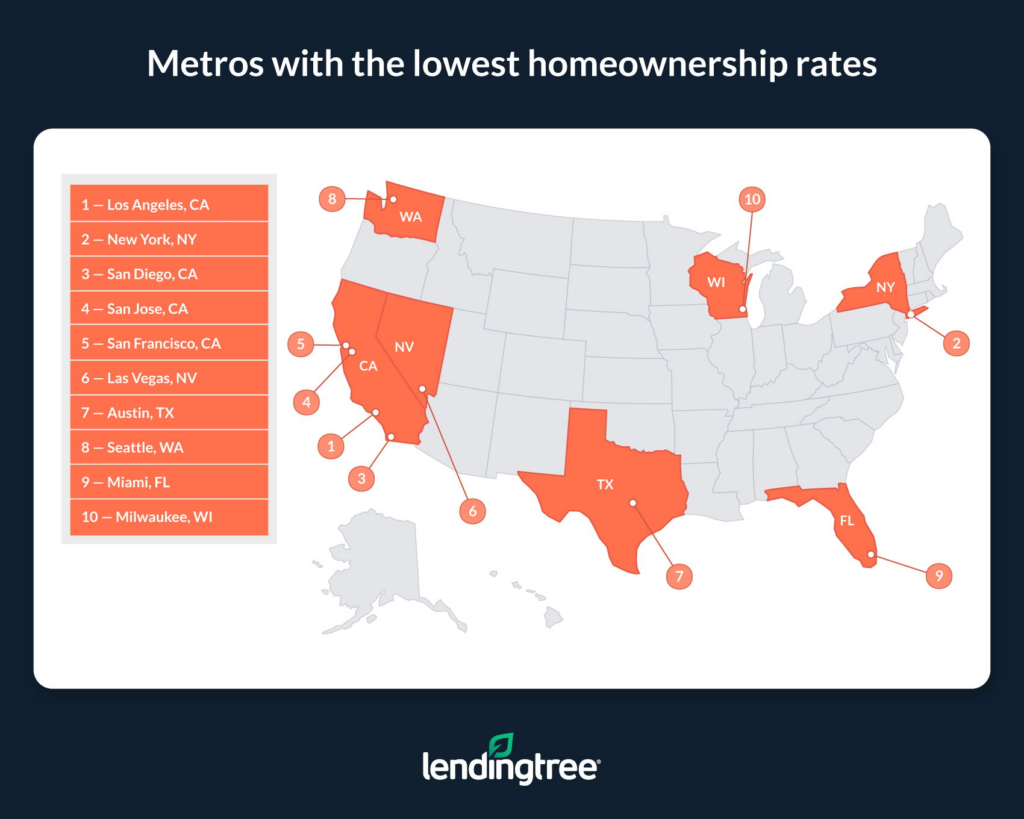
- Homeownership rates are lowest in the Los Angeles, New York, and San Diego metros. At 47.94%, Los Angeles is the only metro among the 50 largest where the homeownership rate is lower than 50.00%. In New York and San Diego, homeownership rates are higher—albeit still relatively low—at 51.72% and 54.53%.
- Homeownership rates increased the most in Las Vegas, Virginia Beach, VA, and New Orleans from 2019 to 2022. Across these three metros, homeownership rates increased by an average of 305 basis points. Conversely, homeownership rates decreased by an average of 57 basis points in Nashville, TN, Salt Lake City, and San Jose, CA.
- From 2012 to 2022, homeownership rates increased the most in Las Vegas, New Orleans, and Phoenix. On average, homeownership rates in these metros increased by 524 basis points from 2012 to 2022. Over that same period, homeownership rates increased in 37 of the nation’s other 50 largest metros, remained the same in one, and declined in nine. Homeownership rates decreased the most in Miami, San Jose, CA, and Memphis, TN, falling by an average of 167 basis points.
Per the report, homeownership rates have increased despite rising home prices. From 2012 to 2022, median home values across the nation’s 50 largest metros increased from 25.39% to 197.73%. The average increase across these metros was 97.38%. Despite this, homeownership rates still rose (barring a handful of exceptions).
Top 10 Metros with the Highest Homeownership Rates:
- Detroit
- Minneapolis
- Pittsburgh
- St. Louis
- Birmingham, AL
- Louisville, KY
- Cincinnati
- Raleigh, NC
- Salt Lake City
- Richmond, VA

Metros with the Highest Homeownership Rates:
1. Detroit
- Total number of occupied housing units: 1,762,104
- Share of housing units that were owner-occupied in 2022: 71.49%
- Share of housing units that were renter-occupied in 2022: 28.51%
- Increase in share of owner-occupied housing units from 2019 to 2022: 1.87 percentage points
- Increase in share of owner-occupied housing units from 2012 to 2022: 2.44 percentage points
- Median home value: $245,500
- Percentage growth in median home value from 2019 to 2022: 28.00%
- Percentage growth in median home value from 2012 to 2022: 111.27%
2. Minneapolis
- Total number of occupied housing units: 1,483,453
- Share of housing units that were owner-occupied in 2022: 70.54%
- Share of housing units that were renter-occupied in 2022: 29.46%
- Increase in share of owner-occupied housing units from 2019 to 2022: 0.38 percentage points
- Increase in share of owner-occupied housing units from 2012 to 2022: 1.11 percentage points
- Median home value: $359,800
- Percentage growth in median home value from 2019 to 2022: 26.47%
- Percentage growth in median home value from 2012 to 2022: 76.63%
3. Pittsburgh
- Total number of occupied housing units: 1,021,314
- Share of housing units that were owner-occupied in 2022: 70.45%
- Share of housing units that were renter-occupied in 2022: 29.55%
- Increase in share of owner-occupied housing units from 2019 to 2022: 2.26 percentage points
- Increase in share of owner-occupied housing units from 2012 to 2022: 1.00 percentage points
- Median home value: $209,800
- Percentage growth in median home value from 2019 to 2022: 26.46%
- Percentage growth in median home value from 2012 to 2022: 68.79%
Top 10 Metros with the Lowest Homeownership Rates:
- Los Angeles
- New York
- San Diego
- San Jose, CA
- San Fransisco
- Las Vegas
- Austin, TX
- Seattle
- Miami
- Milwaukee

Metros with the Lowest Homeownership Rates:
1. Los Angeles
- Total number of occupied housing units: 4,500,951
- Share of housing units that were owner-occupied in 2022: 47.94%
- Share of housing units that were renter-occupied in 2022: 52.06%
- Decrease in share of owner-occupied housing units from 2019 to 2022: -0.27 percentage points
- Decrease in share of owner-occupied housing units from 2012 to 2022: -0.49 percentage points
- Median home value: $847,400
- Percentage growth in median home value from 2019 to 2022: 27.07%
- Percentage growth in median home value from 2012 to 2022: 97.76%
2. New York
- Total number of occupied housing units: 7,478,571
- Share of housing units that were owner-occupied in 2022: 51.72%
- Share of housing units that were renter-occupied in 2022: 48.28%
- Increase in share of owner-occupied housing units from 2019 to 2022: 0.87 percentage points
- Increase in share of owner-occupied housing units from 2012 to 2022: 0.36 percentage points
- Median home value: $578,800
- Percentage growth in median home value from 2019 to 2022: 19.86%
- Percentage growth in median home value from 2012 to 2022: 44.70%
3. San Diego
- Total number of occupied housing units: 1,172,343
- Share of housing units that were owner-occupied in 2022: 54.53%
- Share of housing units that were renter-occupied in 2022: 45.47%
- Increase in share of owner-occupied housing units from 2019 to 2022: 0.70 percentage points
- Increase in share of owner-occupied housing units from 2012 to 2022: 1.41 percentage points
- Median home value: $846,600
- Percentage growth in median home value from 2019 to 2022: 36.70%
- Percentage growth in median home value from 2012 to 2022: 119.10%
Even While Facing Affordability Challenges, Homeowners are Here to Stay
According to LendingTree research, most of the country’s main metro areas now have higher homeownership rates than they had in 2019 and 2012. This is true even though the value of homes in major metro areas is increasing significantly.
Although these increased rates of homeownership show that there are still options for people to own real estate even as property values rise, it doesn’t guarantee that everyone will be able to achieve their dream of owning a home or that it will be without difficulties. On the contrary, many have found purchasing challenging in recent years due to a combination of rising housing prices and steadily high mortgage rates. This is demonstrated by the fact that mortgage demand has been at or close to its lowest levels in decades since the beginning of 2023.
Despite this, millions of Americans own their houses, and new construction is constantly happening. Mortgage offers are being made to demographics like millennials and first-time homebuyers, who generally have less money available to them.
Although navigating the current housing market isn’t always simple, homeownership isn’t going away, and the U.S. isn’t about to turn into a country of mostly renters any time soon.
To read the full report, including more data, charts, and methodology, click here.


