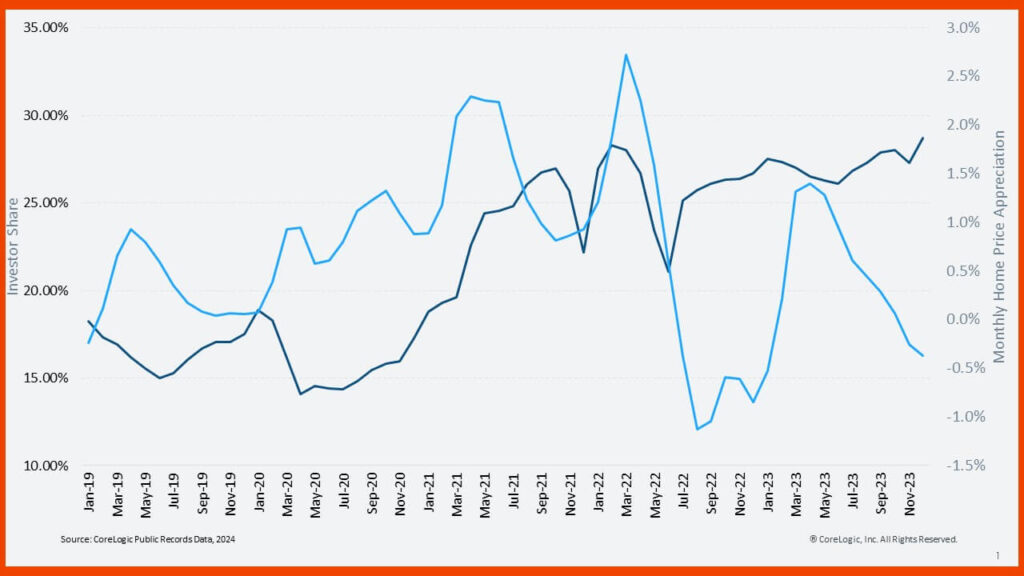
CoreLogic has produced another report showing the signs of the times as in the fourth quarter of 2023 investors bought 28% of all homes, making it a distinct possibility that investor purchases could rise above 30% in 2024.
A look at investor activity versus home price appreciation, 2019-today

The figure above shows the share of purchases made by home investors since 2019 according to the U.S. CoreLogic Case-Shiller Index. The connection between price appreciation and investor activity has been inconsistent over the past few years, especially during the first year of the COVID-19 pandemic. For instance, in 2019 and 2020, the two metrics always moved in opposite directions, while the intense appreciation of 2021 and 2022 coincided with an unprecedented leap in investor purchases.
However, according to the same dataset, home price appreciation has since slowed, but investor activity has remained relatively high. Elevated interest rates have stymied price appreciation but not home investors, and there is no sign that the investor share will fall back to its pre-pandemic level of less than 20% as recorded in the first half of 2023. Indeed, the Federal Reserve has yet to cut rates, and prices still are high, fueling strong rental demand that investors are seizing upon.
Investor versus non-investor sales volume

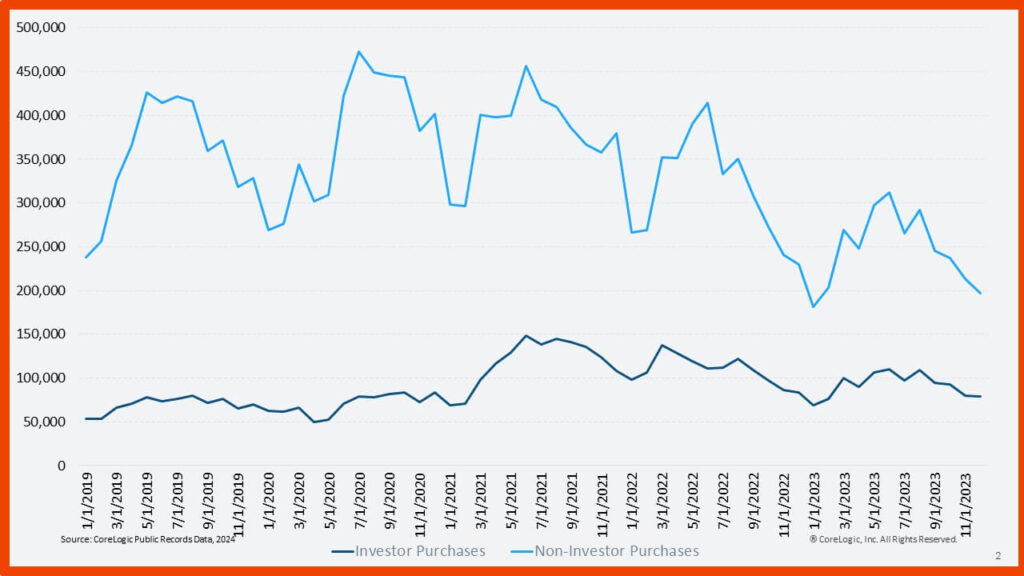
According to CoreLogic, the sizable home investor share masks what it really a cold market. Figure 2 illustrates the number of U.S. home purchases made by both investors and non-investors through December 2023. Investor purchases are strong only compared with owner-occupied purchases.
Home investors made 92,000 purchases in October 2023 before backing off to a respective 80,000 and 79,000 properties in November and December. These numbers are comparable to those recorded in 2022, 2020 and 2019, which show that the true investor surge was in 2021 and that the investor share now is more a sign of their resiliency to high interest rates than owner-occupied buyers.
As of the beginning of the year, investors may have mostly returned to their pre-pandemic levels of activity, but the image above shows a stark contrast to owner-occupied buyers, who are purchasing about 100,000 fewer homes per month than they were before 2022.
Investors buying from investors?

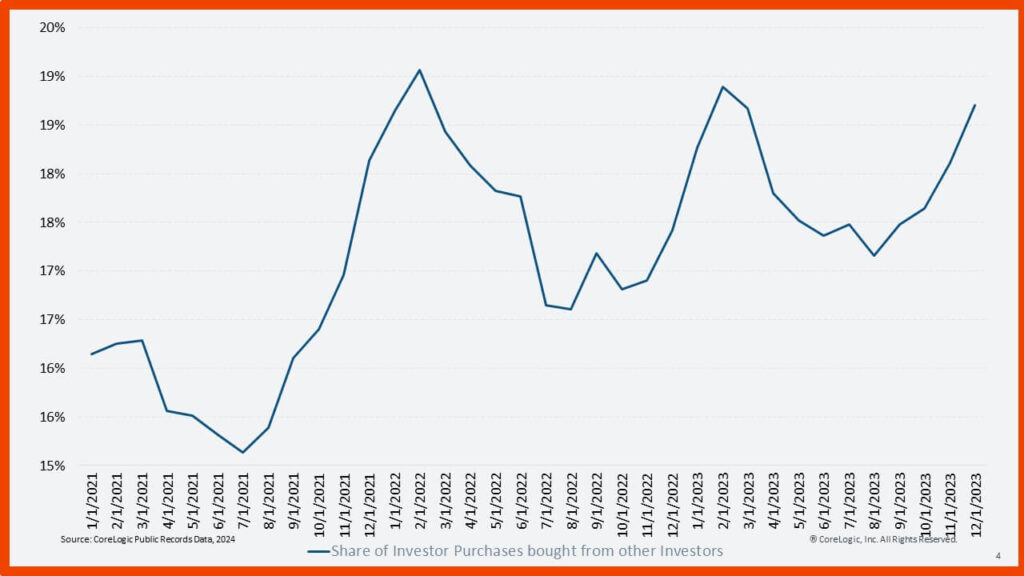
Investors are likely only making a small dent in homeownership numbers, with Figure 4 showing the share of investors that purchased properties from other investors. This number has ebbed and flowed from 16% to 19% over the past few years. Investors also make around 10% of their purchases on new homes and resell around 15% of their real estate portfolios.
By CoreLogic’s standards, given that investors buy around 900,000 homes per year, a loose calculation would put around 300,000 homes moving from owner-occupied to investor owners in a given year.
While 300,000 properties are a substantial number, it stands for less than 0.5% of the total U.S. housing stock. So, to see a notable decline in the homeownership rate, the increased investor activity would have to hold steady for a very long time, and that is not even accounting for additional factors. For example, the effect of home investor purchases could offset if some landlords also choose to sell homes to first-time homebuyers.
Home flipper, iBuyer activity continue downward trend

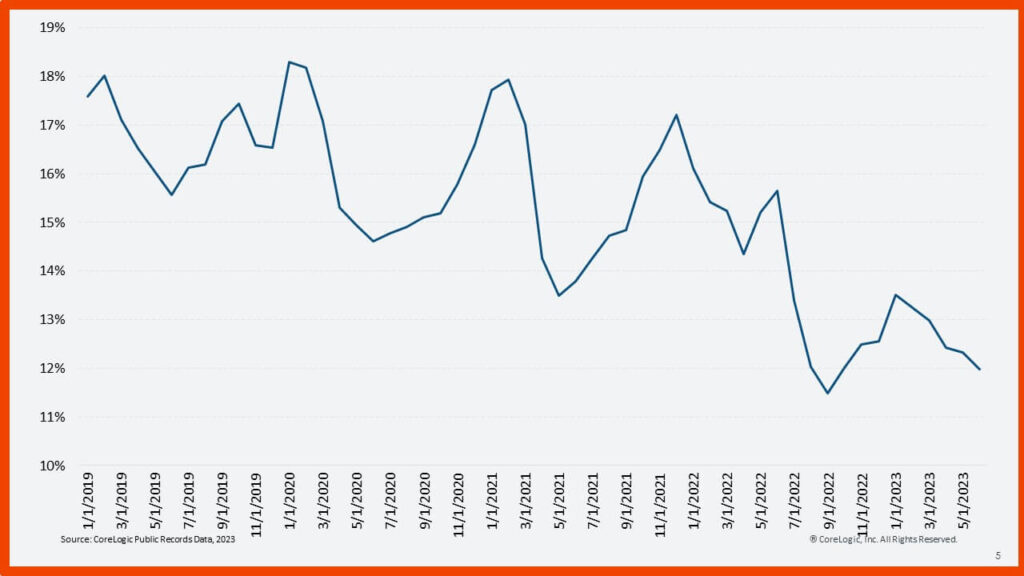
As costs rise and profits dry up, home-flipping activity has been a generally downward trend (with occasional spikes) since the beginning of the pandemic. The share of homes purchased by investors who resold properties within six months through June 2023. Only 12% of investors who purchased a home in March 2023 resold by the end of December 2023. The downward trend is clear in the data: about a 1 percentage point decline every year. This is not surprising, as flipping is a relatively less attractive business model than renting out a home when appreciation is slow and interest rates are high.
Finally, according to CoreLogic, nowhere is the decline of flipping clearer than in the purchasing habits of iBuyers. The image above shows iBuyer market activity through December 2023.
Throughout 2023, iBuyers accounted for less than 0.5% of all purchases and less than 2% of investor purchases. IBuyers purchased only around 1,000 homes per month in 2023. This is a huge decline from 2021 and 2022, when iBuyers were purchasing between 5,000 and 9,000 homes per month at certain points.
Click here for the article in its entirety.


