


LendingTree has analyzed the latest U.S. Census Bureau American Community Survey, and while we may have a long way to go before the nation’s housing shortage is fully addressed, this study gauges the progress.
The study found that across the nation’s 50 largest metros, 1.48 million housing units were built from 2020 through 2022, as just 1.95% of these metros’ 75.89 million housing units were built from 2020 through 2022.
Recently built housing units made up the largest share of homes in three South metros, Austin, Texas; Nashville, Tennessee; and San Antonio, Texas. In these metros, 5.97%, 5.04% and 4.74% of housing units, respectively, were built from 2020 through 2022. These markets experienced such growth between 2020 and 2022 due to spikes in population, which can also spur new construction.
New homes make up the smallest share of the housing supply in the three Northeast metros of Hartford, Connecticut; Buffalo, New York; and Providence, Rhode Island, where, in these metros, 0.47%, 0.59% and 0.67% of housing units, respectively, were built from 2020 through 2022.
For the report, LendingTree analyzed the latest U.S. Census Bureau American Community Survey. While recently built houses aren’t particularly common in the nation’s 50 largest metropolitan areas, Southern states tend to have more new homes than their northern counterparts.
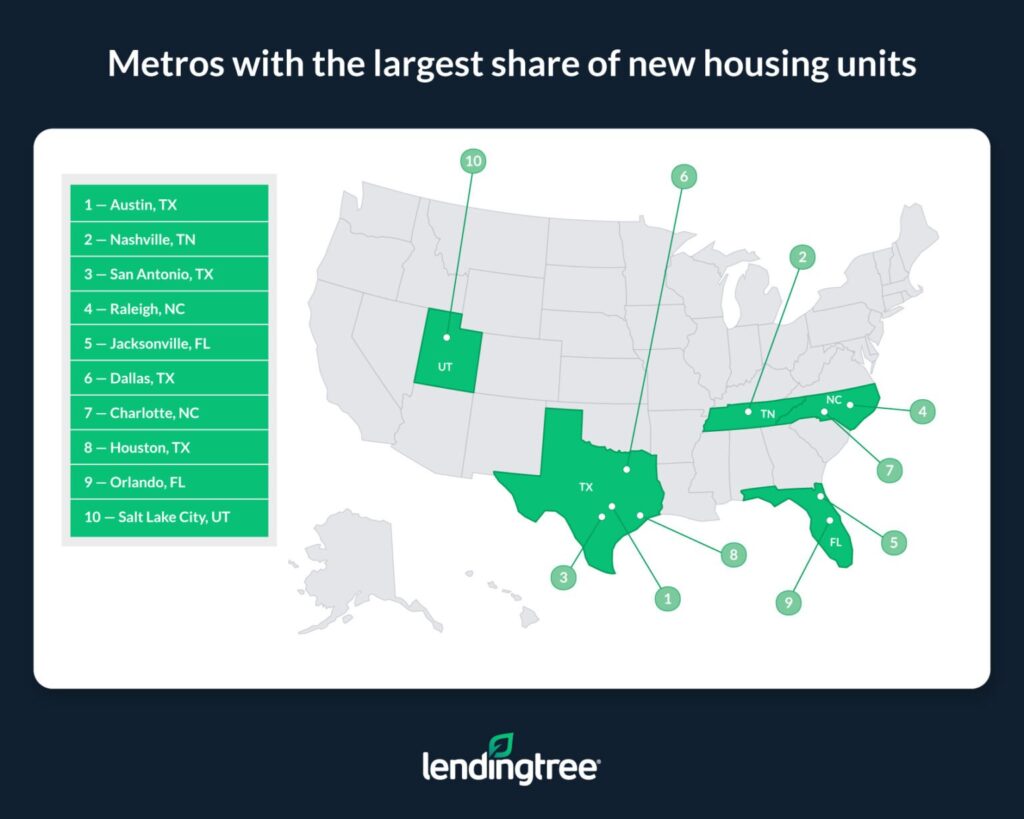
Metros with the largest share of new housing
Austin, Texas topped the list of metros with new housing units, with 1,048,041 total housing units, and a share of housing units built from 2020-2022 of 5.97%. The median value of housing units built from 2020-2022 was $473,900, with the median value of all housing units at $490,000. The difference between the median value of housing units built from 2020-2022 and median value of all housing units was $16,100.
Coming in second on the list was Nashville, Tennessee, where 889,476 total housing units were constructed. The share of housing units built from 2020-2022 was 5.04%. The median value of housing units built in Nashville from 2020-2022 stood at $495,700, with the median value of all housing units at $421,500. The difference between the median value of housing units built from 2020-2022 and median value of all housing units was $74,200.
Rounding out the top three was the Texas metro of San Antonio, which reported 1,057,291 total housing units. The share of housing units built from 2020-2022 was 4.74%. The median value of housing units built from 2020-2022 stood at $357,000, while the median value of all housing units was $275,700. The difference between the median value of housing units built from 2020-2022 and median value of all housing units was $81,300.
Rounding out the top 10 U.S. metros with the largest share of new housing included:
- Raleigh, North Carolina
- Jacksonville, Florida
- Dallas, Texas
- Charlotte, North Carolina
- Houston, Texas
- Orlando, Florida
- Salt Lake City, Utah
Metros with the smallest share of new housing
The nation’s metros with the smallest share of new housing units was topped by Hartford, Connecticut, where just 527,857 total housing units were built, and the share of housing units built from 2020-2022 stood at 0.47%. The median value of housing units built from 2020-02022 was $464,000, with the median value of all housing units at $305,700. The difference between the median value of housing units built from 2020-2022, and the median value of all housing units was $158,300.
Coming in second was the New York metro of Buffalo, which found that 541,766 total housing units were built, and the share of housing units built from 2020-2022 was just 0.59%. The median value of housing units built from 2020-2022 was $457,500, while the median value of all housing units stood at $219,300. The difference between the median value of housing units built from 2020-2022 and median value of all housing units was $238,200.
Rounding out the top three was the New England metro of Providence, Rhode Island which saw 731,061 total housing units built, and the share of housing units built from 2020-2022 rose just 0.67%. The median value of housing units built from 2020-2022 stood at $611,800, with the median value of all housing units at $398,300. The difference between the median value of housing units built from 2020-2022, and the median value of all housing units was $213,500.
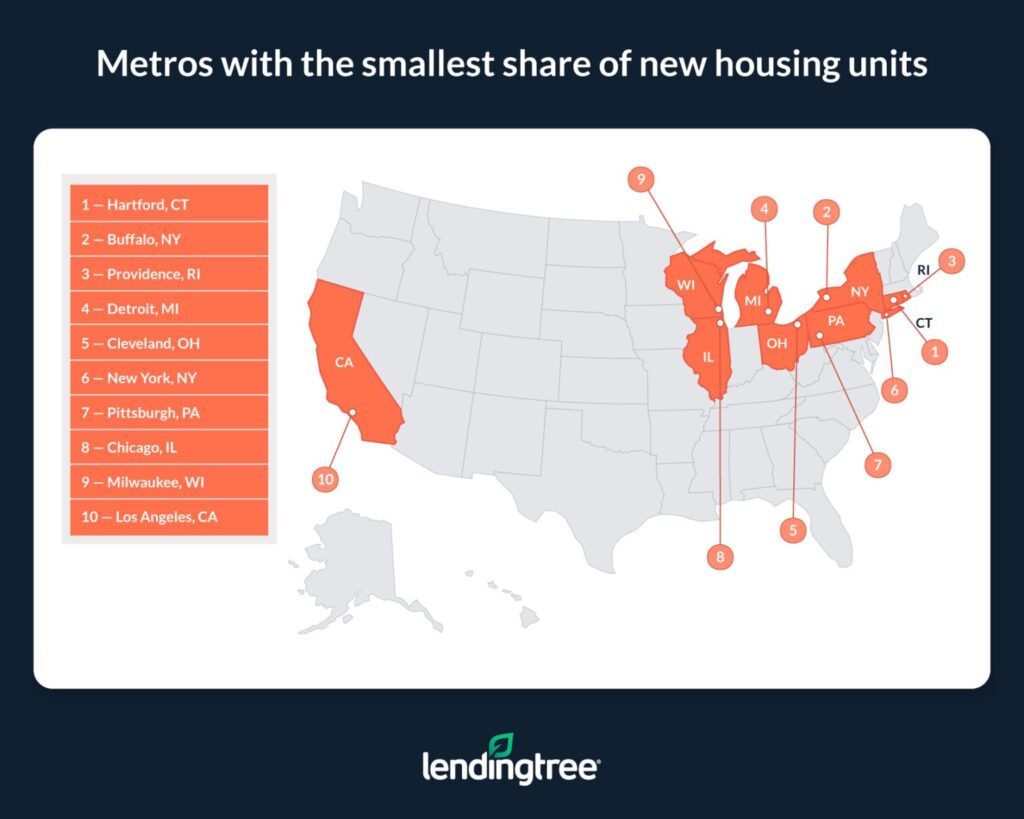
Rounding out the top 10 U.S. metros with the smallest share of new housing included:
- Detroit, Michigan
- Cleveland, Ohio
- New York, New York
- Pittsburgh, Pennsylvania
- Chicago, Illinois
- Milwaukee, Wisconsin
- Los Angeles, California
According to Zillow, the average U.S. home value currently stands at $354,179, up 4.1% over the past year.
For the study, LendingTree analyzed U.S. Census Bureau 2022 American Community Survey data with one-year estimates. The data was compiled at the metropolitan statistical area (MSA) level.
Click here for more on LendingTree’s findings.