According to a new survey from Forbes Advisor, renting, not buying, is now cheaper in America’s 50 largest metro areas. But with home prices across the country now up 6.1% as of April 2024 compared to the same time last year based on reports from 2,000 renters.
Even more surprising, 34% of these surveyed renters have no plans to buy a home in the future.
For those renters who do plan to buy a home over the course of the next few years, the top three reasons they can’t buy sooner are all related to finances: high home prices (56%), the lack of a down payment (42%), and high interest rates (29%).
To find the best and worst cities for renters, Forbes Advisor analyzed the 95 most populous metropolitan areas in the country—to identify the best cities, Forbes Advisor considered factors including rent-to-income ratios, median rental prices, availability, and amenity prevalence, among others.
Key Takeaways
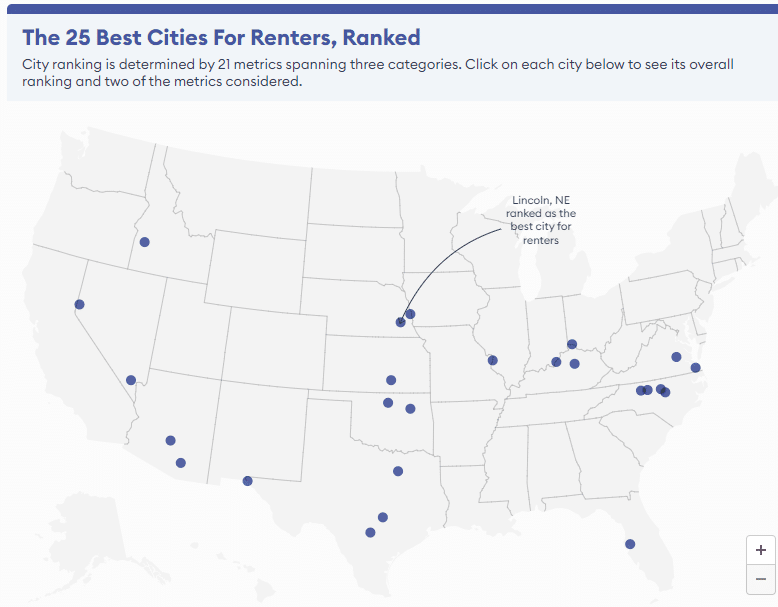
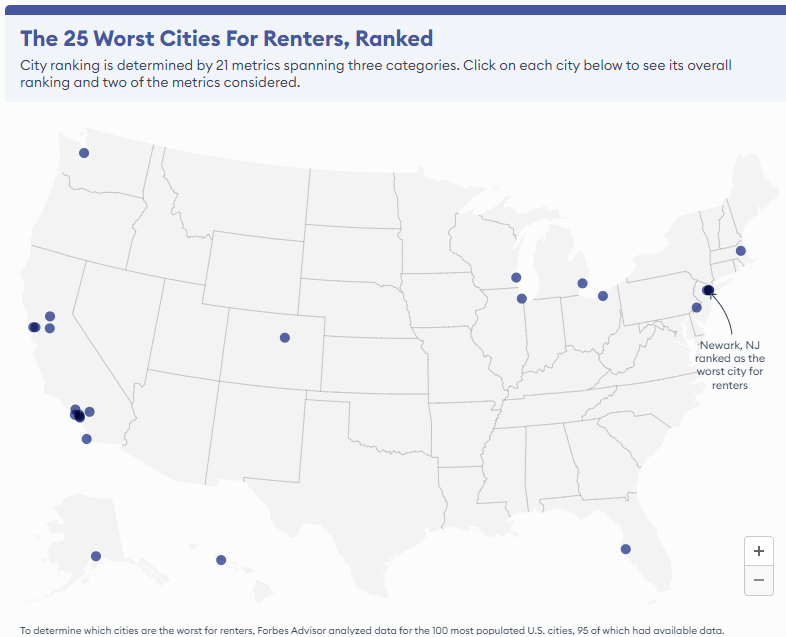
- The best city for renters is Lincoln, Nebraska, and the worst city is Newark, New Jersey.
- For the second year in a row, Newark (No. 1 worst city for renters) ranked higher than its neighboring city, New York City (No. 3 worst city for renters), due in part to higher rental price changes in the last year (up $250, compared to NYC’s $22 drop) and fewer available rental units per 100,000 households (8.5 for Newark vs. 137.2 for NYC).
- The states of Nebraska, Kentucky are home to two of the top 10 best cities for renters, and North Carolina is home to three.
- Half of the 10 worst cities for renters are located in California, thanks in part to the state’s above-average median rent costs and lower-than-average availability of rentals.
- The median price for a rental among the 95 U.S. cities considered in our study is $1,995 and the average price per square foot is $2.09.
The best cities for renters include

1. Lincoln, Nebraska
- Lincoln’s score: 100 out of 100
- Lincoln ranked in the top 10 in the following metrics:
- Fifth best for median monthly rent price at $1,225, compared to the study average of $1,995.
- 10th best for rent as a percentage of income at 17.6%, compared to the study average of 21.3%.
- Fourth best for the number of available rentals per 100,000 households with 394, compared to the study average of 164.
- Ninth best for the average monthly price per sq. ft. at $1.33 (a tie with Winston-Salem), compared to the study average of $2.09.
- Fourth best for its 2.6% unemployment rate, compared to the study average of 4.1%.
2. Omaha, Nebraska
- Omaha’s score: 98.01 out of 100
- Omaha ranked well in the following metrics:
- 15th best for median monthly rent price at $1,384, compared to the study average of $1,995.
- Fourth best for rent as a percentage of overall income at 16.6%, compared to the study average of 21.3%.
- Eighth best for an average monthly price per sq. ft. of $1.32 compared to the study average of $2.09.
- Eighth best for the percentage of units with on-site parking at 68.8%, compared to the study average of 52.8%. A Forbes Advisor survey found that having at least one guaranteed parking spot ranked as the second-most necessary amenity for renters (65%).
3. Raleigh, North Carolina
- Raleigh’s score: 96.93 out of 100
- Overall, Raleigh ranked in the better half of 16 of the 21 metrics considered in this study:
- 18th best for rent as a percentage of income at 18.4%, compared to the study average of 21.3%.
- Fourth-best in the availability and amenities category.
- 16th best for percentage of non-apartment rentals at 70%, in comparison to the study average of 48.4%.
4. Austin, Texas
- Austin’s score: 94.24 out of 100
- Austin ranked in the top 10 in the following metrics:
- Eighth best for rental price changes in the last year at -$250, compared to the study average of -$43.
- Second best in terms of available rentals per 100,000 households with 399 vs. the study average of 164.
- Third best for the percentage of units with on-site parking at 71.8%, in comparison to the study average of 52.8%.
- Sixth best for the percentage of units with in-unit laundry at 67.8%, compared to the study average of 42.9%. A Forbes Advisor renters’ survey found that in-unit laundry was the third most necessary amenity for renters (60%).
- Sixth best for the percentage of units with AC at 76.4% vs. the study average of 56%. Having AC or central air was the most necessary amenity among 2,000 renters (77%) according to the Forbes Advisor renters’ survey.
5. Oklahoma City, Oklahoma
- Oklahoma City’s score: 92.1 out of 100
- Overall, Oklahoma City ranked in the top half of 11 of the 21 metrics considered in this study:
- Oklahoma City ranked as the second-best city in the affordability category, and in the top 10 in the following metrics:
- Ninth best for median monthly rent price at $1,300 (a tie with Cincinnati), compared to the study average of $1,995.
- Fourth best for the average monthly price per sq ft at $1.16 vs. the study average of $2.09.
The worst places for renters were found to be

1. Newark, New Jersey
- Newark’s score: 0.0 out of 100
- Newark ranked as the eighth-worst city in the affordability category:
- It was the worst city for rental price changes in the last year at $250 (the study average was -$43.)
- Newark also ranked as the worst city in the availability and amenities category. It ranked in the bottom five for the following metrics:
- Fourth worst for available rentals per 100,000 households at 8.5 vs. the study average of 164.
- Fourth worst for the percentage of non-apartment rentals at 9.3% as compared to the study average of 48.4%.
2. Long Beach, California
- Long Beach’s score: 7.27 out of 100
- Long Beach ranked as the sixth-worst city in the affordability category:
- It was fifth worst for rent as a percentage of income at 25.8% (a tie with Anaheim and Los Angeles) compared to the study average of 21.3%.
- Long Beach also ranked as the second-worst city in the availability and amenities category:
- Seventh worst for the percentage of non-apartment rentals at 15.4% vs. the study average of 48.4%.
- Seventh worst for the percentage of units with AC at 26.7%, compared to the study average of 56%.
3. New York, New York
- New York’s score: 13.07 out of 100
- New York ranked as the fifth-worst city in the affordability category:
- Worst city for the average monthly price per sq. ft. at $6.88, compared to the study average of $2.09.
- Second worst for the monthly median rent price of $3,573 vs. the study average of $1,995.
- New York also ranked 11th-worst in the availability and amenities category:
- Worst city for the percentage of non-apartment rentals at 5.2% vs. the study average of 48.4%.
- The worst city for the percentage of units with on-site parking at 15.8% as compared to the study average of 52.8%.
4. Anaheim, California
- Anaheim’s score: 13.54 out of 100
- The home of Disneyland ranked as the second-worst city in the affordability category:
- The sixth worst for rental price changes, with average rental prices jumping $105 year over year, compared to the study average decrease of -$43.
- Seventh-worst for rent as a percentage of income at 25.8% (a tie with Long Beach and Los Angeles) vs. the study average of 21.3%.
- Anaheim is also the second worst city for the number of available rental units per 100,000 households at 7, compared to the study average of 164.
5. Oakland, California
- Oakland’s score: 19.79 out of 100
- Oakland ranked in the bottom 10 in the following metrics:
- The 10th worst for the average monthly price per sq. ft. at $3.27 vs. the study average of $2.09.
- Ninth worst for the percentage of units that allow pets at 17% vs the study average of 33.6%. In a Forbes Advisor survey of 2,000 renters, 52% of renters said a pet-friendly unit was a necessity.
- Third worst for the percentage of units with AC at 14.5% vs. the study average of 56%.
- Third worst for the property crime rate per 1,000 residents at 65.5 as compared to the study average of 33.8.
- Fifth worst for the violent crime rate per 1,000 residents at 15.3 compared to the study average of 7.4.
- 10th worst for the percentage of non-apartment rentals at 18.2% vs. the study average of 48.4%.
So what exactly are renters looking for? The things they are looking for are mainly creature comforts such as a pet-friendly unit (52%), central air conditioning (77%), guaranteed parking (65%), and in-unit washer and dryers (60%).
In choosing the ideal location, renters listed their top three most important considerations as crime (52%), the cost of living in the area (48%) and the distance to work (28%)
Do Renters Plan to Buy?
34% of renters plan to continue renting and nearly half of all renters (49%) said in a recent Forbes Advisor survey they are renting because they can’t afford to buy a home.
However, most renters do plan to buy in the near future, with 11% saying they plan to buy in the next 12 months, and 55% saying they have plans to buy, just not in the next year.
These are the top three reasons renters cited for not buying something sooner: home prices (56%), a lack of down payment (42%), and high interest rates (29%).
Click here to see the report in its entirety, including methodology for the 2,000 respondents.


