The Single-Family Rental (SFR) inventory and days-on-market continue to climb gradually, according to HouseCanary, Inc.‘s most recent National Rental Report, which rose by 16.7% and 15.4%, respectively. Trends observed in the southern states were the primary cause of the increases in both indicators.
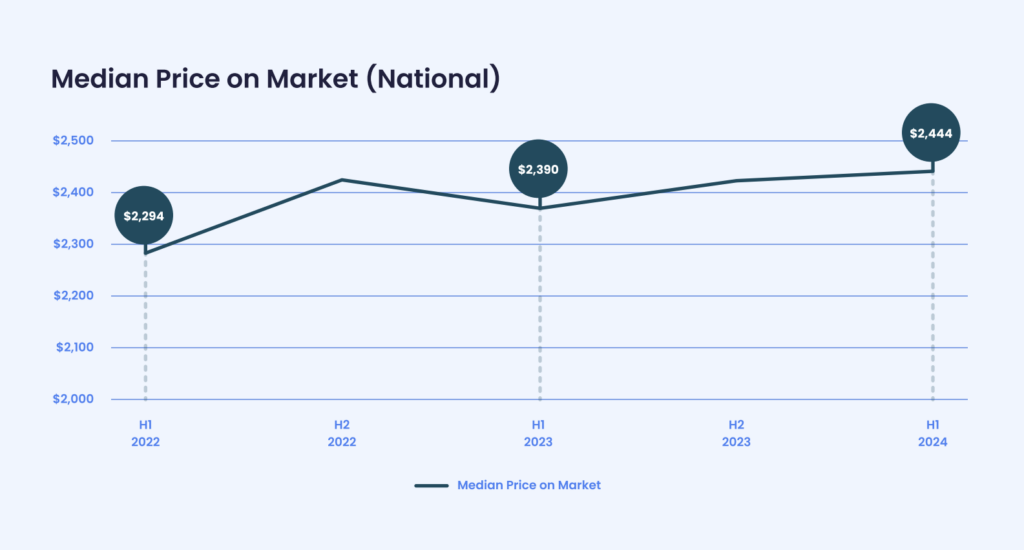
As a result, and in line with earlier data, the steady increase in days-on-market and inventory levels, along with the continued demand for rentals as an alternative to house ownership, led to a minor 2.3% increase in the median national rent price over the prior year.
“Our latest report generated results well-within our expectations, with a spike in inventory levels and days-on-market, particularly in the southern states,” said Chris Stroud, Co-Founder and Chief Research Officer for HouseCanary. “While the region saw strong and increasing demand in housing due to in-migration during the pandemic and ultimately drove real estate developments, that is no longer the case at this time. Florida is the perfect case study for this as the state saw the biggest increase in pricing between 2021-2022, but our latest report showed the opposite trend, with the state seeing the most significant decrease in pricing in the first half of this year.”
Key findings about the rental market for single-family detached listings in the first half of 2024:
- Available-for-rent inventory nationwide shoots up: In H1 2024, available-for-rent inventory continued to increase 16.7% compared to the previous year. As a result, this half only saw marginal year-over-year increases in median SFR prices at just 2.3%, similar to the previous report.
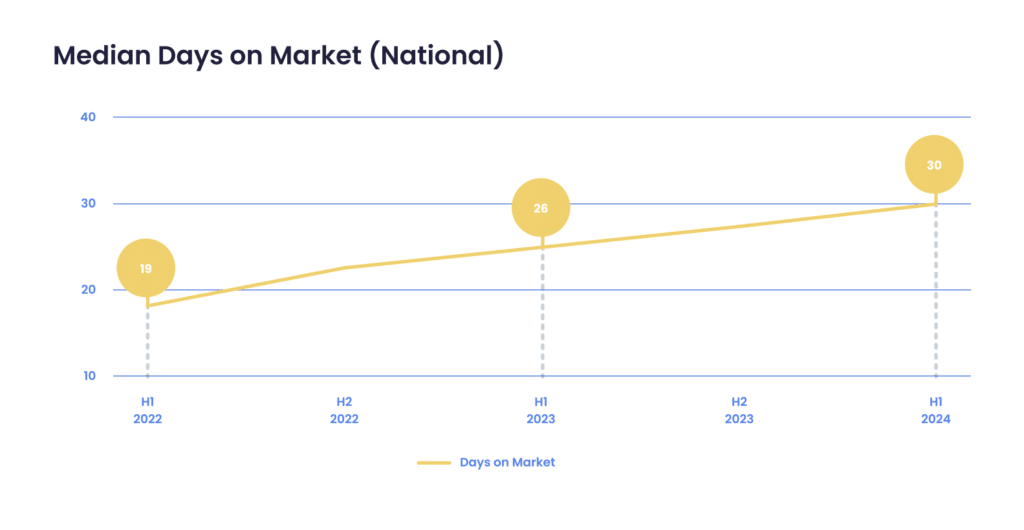
- Continued inventory influx results in days-on-market surge: The average days-on-market experienced a surge of 15.4% year-over-year. The increase in days-on-market was led by southern states, coupled with the region’s increase in inventory levels. Greenville-Anderson-Mauldin, SC saw the most significant increase in days-on-market, 145.2%.
- Southern states leading the increase in inventory: The top ten MSAs that experienced the most significant increase in inventory levels were all southern states, led by Florida. The increase in inventory does not necessarily signal only a decrease in demand, but may be the result of other external factors, such as ongoing real estate developments and investments that drive supply up.
- Florida’s Ongoing Rental Rollercoaster: Six out of the top ten MSAs that experienced the largest annual decrease in listing prices were in Florida, opposite of the trends seen almost two years ago in H2 2022 when Florida MSAs experienced the highest price increases. This can potentially signal a return to historically-normal price levels in the state.
Brandon Lwowski, Senior Director of Research at HouseCanary, added: “Furthermore, we continue to see a slight uptick in listing prices, which were up 2.3% from the same period last year. People are still choosing to rent as opposed to buying homes, in order to unshackle themselves from the long-term financial commitments of purchasing. On top of that, interest rates remain at multi-year highs, which further hinder buying capabilities. With the anticipated cutting of interest rates in the remainder of the year, we look forward to seeing how this can potentially shape the housing market in the second half of 2024.”

Rental Listing Inventory Up YoY
Rental listing inventory is up 16.7% year over year (YoY), and days on market are up 15.4% YoY as of the second half of 2024. These figures suggest that the sector is stable and has strong fundamentals, including a balanced supply and sustained occupancy rates. As the demand for rentals rises and is predicted to remain strong, potentially replacing the desire for home sales, prospective tenants should anticipate seeing sustained growth in rent prices at a slower pace on a nationwide level.
Since there has been no sign of a reduction in interest rates, we can anticipate that this pattern will continue for some time. It is noteworthy that specialists do not anticipate a correction in the property market throughout the latter part of 2024.
The median national rent at the end of H1 (First Half) 2024 was $2,444, a 2.3% rise from H1 2023. The average number of listings on the market increased to 73,207, a 16.7% increase from the previous year.
The number of postings did not significantly grow or decrease in the first half of 2024. Instead, it remained stable. The median days on market increased over the first half of 2024. Even with the rising median price, prospective homeowners cannot afford the market. Although there is a need for housing, in order for future homeowners to enter the market, prices must drop.
Days On Market Sees Largest National Increase
Days on market for the following MSAs increased in H1 2024. The highest annual rise in days on market occurred in Greenville-AndersonMauldin, SC, which increased by 145.2% from 31 days in H1 2023 to 76 days in H1 2024.
Days on market increases may indicate out-migration or oversupply as a result of the area’s declining attractiveness, which is caused by people choosing to live elsewhere where opportunities and external factors are more appealing, such large cities with favorable job markets.

Average Days on Market with the Largest Annual Increases (by MSA):
- Greenville-Anderson-Mauldin, SC
- Memphis, TN-MS-AR
- Daphne-Fairhope-Foley, AL
- Savannah, GA
- Myrtle Beach-Conway-North Myrtle Beach, SC-NC
- Albany-Schenectady-Troy, NY
- Augusta-Richmond County, GA-SC
- Anchorage, AK
- Huntsville, AL
- Gainesville, GA
The rental market’s inventory has increased further, with increases of 96.8% and 91.3% in Cape Coral-Fort Myers, Florida, and Savannah, Georgia, respectively.
According to HouseCanary’s rental analytics, the ten MSAs with the most yearly percent increase in inventory from H1 2023 to H1 2024 are listed below. Four of the ten regions in the following list are in Florida, and they are mostly found in the Southern states. The outcome is probably the result of a number of variables, such as continuing real estate developments and a decline in demand, in addition to other market factors.
Average Weekly Inventory with the Largest Annual Increases (by MSA):
- Cape Coral-Fort Myers, FL
- Savannah, GA
- Montgomery, AL
- Naples-Immokalee-Marco Island, FL
- Myrtle Beach-Conway-North Myrtle Beach, SC-NC
- Gulfport-Biloxi-Pascagoula, MS
- Huntsville, AL
- Lakeland-Winter Haven, FL
- Ocala, FL
- Memphis, TN-MS-AR
The inventory market began to cool by the conclusion of the second half of 2023. Among the top 10 MSAs with the biggest yearly inventory decreases, H1 2024 saw a larger decline in inventory. This could be attributed to a combination of other market conditions, developments, and higher demand in that MSA region.
As previously mentioned, from a national standpoint, rental prices should rise in the near future, suggesting that there is a growing demand for rentals rather than home purchases.
To read the full report, including more data, charts, and methodology, click here.


