With the total number of homes on the market at its greatest point since May 2020 and interest rates about to start declining, buyers will have more options this autumn. The Realtor.com August Housing Trends Report shows that the number of homes actively for sale increased by 35.8% in August, marking the tenth consecutive month of growth in this number of properties. Simultaneously, home sellers reduced the number of newly listed properties on the market, with a -0.9% decrease from the previous year.
“In April we noted that rising for-sale inventory was likely to lead to more balance between buyers and sellers. This August, as the number of homes on the market continues to climb, price cuts are more common, asking prices are moderating, and homes are taking longer to sell. The widely anticipated Fed rate cut has already ushered in lower mortgage rates, but it seems that some buyers and sellers are waiting for additional declines,” said Danielle Hale, Chief Economist at Realtor.com. “As the market slows seasonally, fall is one of the best times to buy a house. Falling mortgage rates are likely to bring out additional home shoppers and a busier fall season than usual, but the boost in activity is unlikely to overwhelm the usual seasonal slowdown. Shoppers, who are out this fall, are likely to face lower competition than is expected in spring 2025 as more shoppers anticipate better mortgage rates.”
While the median price per square foot increased by 2.3% in August compared to the same month last year, the price of homes for sale dropped by 1.3% overall to $429,990. This suggests that the proportion of smaller, more affordable homes in the inventory is still increasing. The slowest August in five years saw homes on the market for 53 days.
U.S. Home Inventory Continues to See Gains
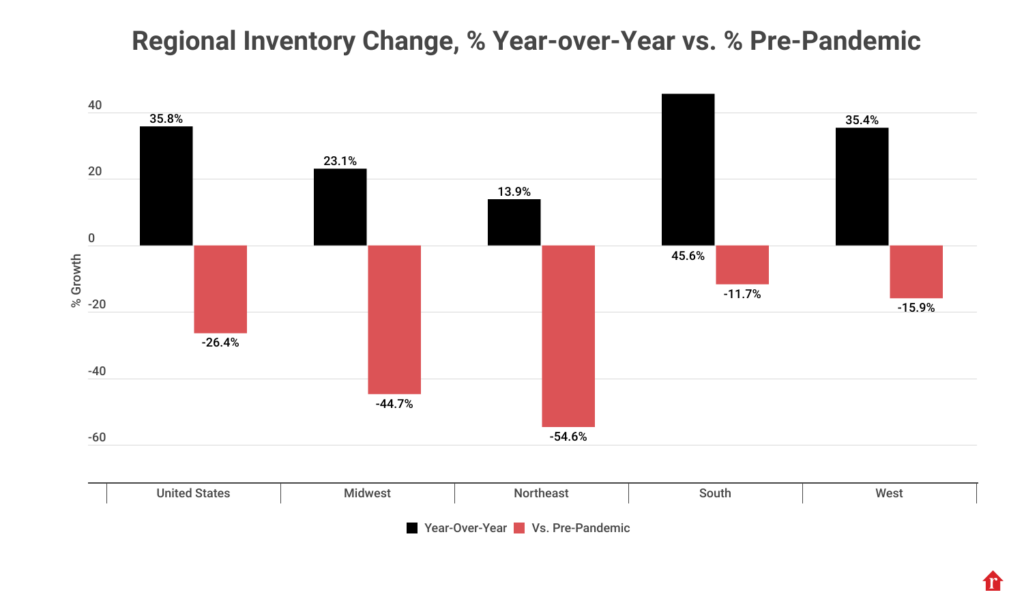
On an average August day, there were 35.8% more homes listed for sale than there were at the same time in 2023. This represents the largest number of active home sales since the pandemic and the twelfth straight month of annual inventory growth. This represents a modest slowdown from July, when there was a 36.6% year-over-year increase. The rate of growth has declined from the previous month for the second consecutive month. Even though August’s inventory is still down 26.4% from August 2019 levels, it is still improving. Compared to the 28.7% difference last month, this is a minor improvement.
The growth in the inventory of homes priced between $200,000 and $350,000 in August, as it did in the preceding six months, exceeded that of all other price ranges. This range’s inventory increased by 46.1% from the previous year and is only marginally lower than last month (47.3%). Smaller, more reasonably priced homes are still more readily available in the South, which is what is causing this growth.
Similar to buyers, sellers reduced their offering in August as newly listed properties dropped 0.9% from July’s levels. This reverses a nine-month trend of rising listing activity. Gains in new listings were observed in July (8.4%). The steep drop in mortgage rates that occurred in the middle of August may cause the marginal homeowner to consider selling, which could result in more listings in the upcoming months.

Average Days On Market Hits A Five Year High
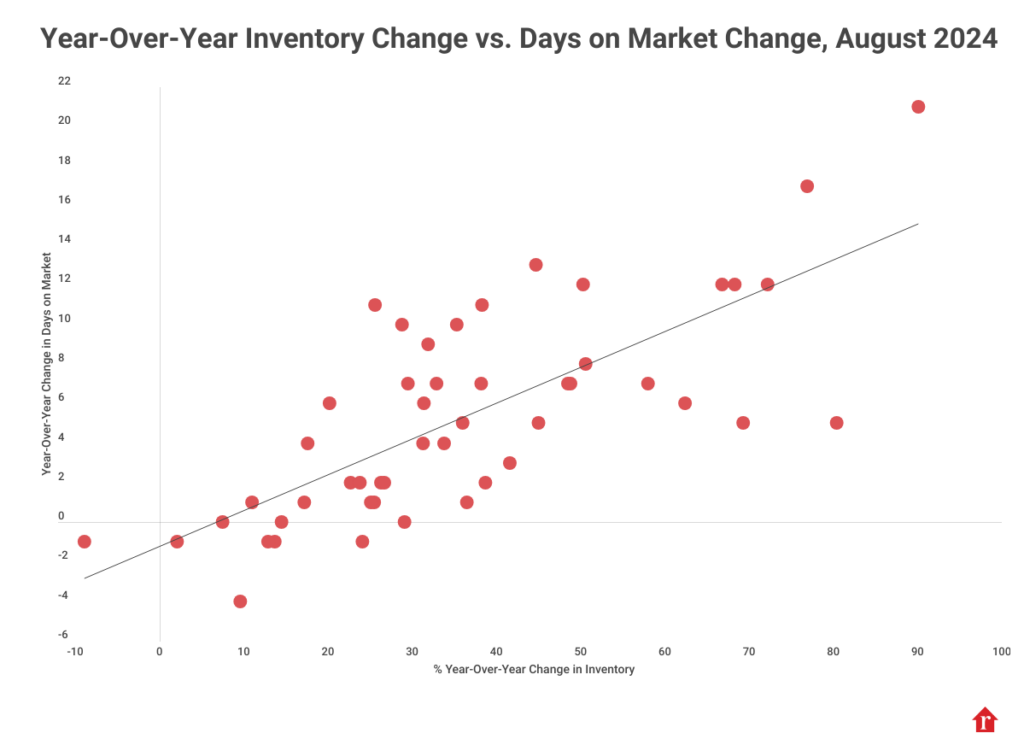
In August, the average home was listed for 53 days, which is seven more days than it was a year earlier. Even yet, time on the market was still six days shorter than the pre-pandemic norm for August, making it the slowest August in five years. All regions are seeing longer times for homes on the market, with the South leading the way with nine days, followed by the Midwest with three days, and the West and Northeast with two days.
“We have found that the market slows by about one day for every 5.5 percentage point increase in the year-over-year number of active listings,” said Ralph McLaughin, Senior Economist at Realtor.com. “Given the rapid growth in inventory we’re seeing now, that can mean changes in some markets of up to 15-20 more days on the market than last year.”
The percentage of properties with price reductions rose to 19.2% in August, up 3.0 percentage points from the previous August, in tandem with an increase in the number of active listings and days on the market. The West (+3.5 percentage points) led the way in the proportion of price decreases, with the Midwest (+3.3 percentage points), South (+2.8 percentage points), and Northeast (+2.0 percentage points) following closely behind.
Due to a shift in the inventory mix toward smaller homes, the national median list price decreased 1.3% to $429,990 in August compared to the previous August. At the same time, the median listing price per square foot increased 2.3%. The price of a typical listed home increased by 36.2% and the price per square foot by 51.0% from August 2019 to the present.

South and West Remain Closest to Bridging Pandemic-Era Inventory Gap
Compared to August of last year, all four U.S. regions had active inventory growth; however, the South and West’s inventory has recovered the greatest from pre-pandemic levels.
In August, there was an increase of 46% in active listings in the South, 35.7% in the West, 23.8% in the Midwest, and 15.1% in the Northeast. With inventory down 12.2% in August compared to the average August in 2017–19, the South had the narrowest inventory gap to pre-pandemic levels. Compared to pre-pandemic levels, inventory was 16.6% lower in the West, 44.9% lower in the Midwest, and 54.5% lower in the Northeast.
Just 11 of the 50 largest metro areas—Austin, Texas (+36.6%), Memphis, TN (+28.7%), and San Antonio (+25.2%)—had higher inventory levels in August than they did before the outbreak.
Comparing August of this year to the same month previous year, listing prices were down 1.5% in the Northeast, level in the West and Midwest, and up 4.3% in the Northeast. When the price per square foot was used to adjust for the variety of properties available on the market, prices across all regions demonstrated higher growth rates, ranging from 1.6% to 5.0%. The largest rises in large metro areas were seen in the median list prices of Milwaukee (+13.2%), Philadelphia (+9.1%), and Cleveland (+8.0%).
In the meanwhile, when compared to homes posted prior to the pandemic, all 50 major metro regions have seen significant price increases. In the top 50 metro areas, the price-per-square-foot growth rate varied from 23.4% to 69.3% when compared to August 2019. The markets where sellers experienced the biggest increases in price per square foot were Nashville (+63.1%), Tampa (+63.4%), and the New York metro area (+69.3% vs. August 2019). San Francisco (+23.4%), New Orleans (+24.0%), and San Jose (+25.3%) had the lowest returns.
To read the full report, including more data, charts, and methodology, click here.


