The largest percentage for any August since 2019 is found in nearly half (48%) of all listings that have been active for at least 60 days. For the seventh consecutive month, the percentage of residences left unoccupied for at least 60 days increased annually. For the fifth consecutive month, the percentage of homes listed for 60 days increased, according to recent Redfin data.
Since this data is seasonal—it usually peaks in the winter and troughs in the spring—we concentrate on changes from year to year. August saw a further slowdown in the lackluster summer market, with home sales reaching a record low since the epidemic began.
“We usually see home sales pick up when mortgage rates fall, but this year we are seeing the opposite—sales are dropping and homes are sitting longer on the market,” said Sheharyar Bokhari, Senior Economist at Redfin. “Last week’s big interest rate cut by the Federal Reserve will give buyers a boost in confidence.”
Most U.S. Homes Sitting on the Market for at Least a Month
Up from 63.9% a year ago, nearly seven out of 10 homes—an estimated 68.5%—on the market last month had been vacant for at least 30 days. Further, for the sixth consecutive month, the percentage of homes listed for at least 30 days has increased.
The percentage of month-old listings rose for the sixth month in a row, and it was the highest percentage for any August since before the pandemic began in 2019.
“For a home to sell fast, or with multiple bids, it needs to be immaculately presented and have a unique design, or additional features like a pool,” said Andrew Vallejo, a Redfin Premier agent in Austin, Texas. “I had a home receive multiple offers about a month ago—a rarity for us at the moment. It sold quickly and for $25,000 over list price because of how pretty it was—everything was perfectly painted, clean and manicured.”
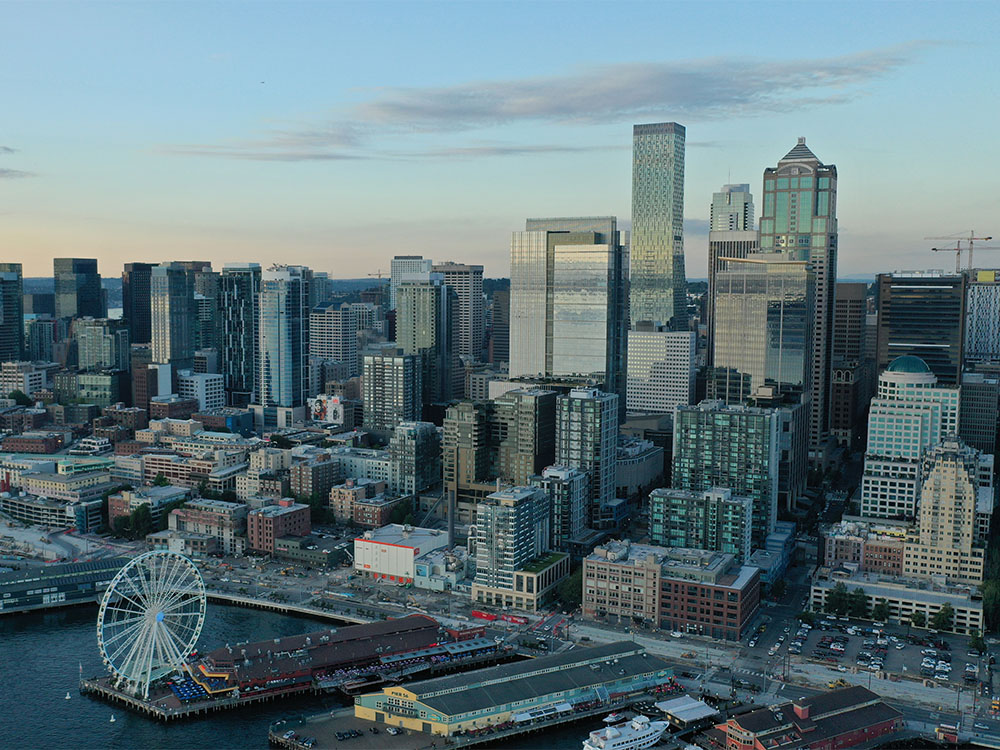
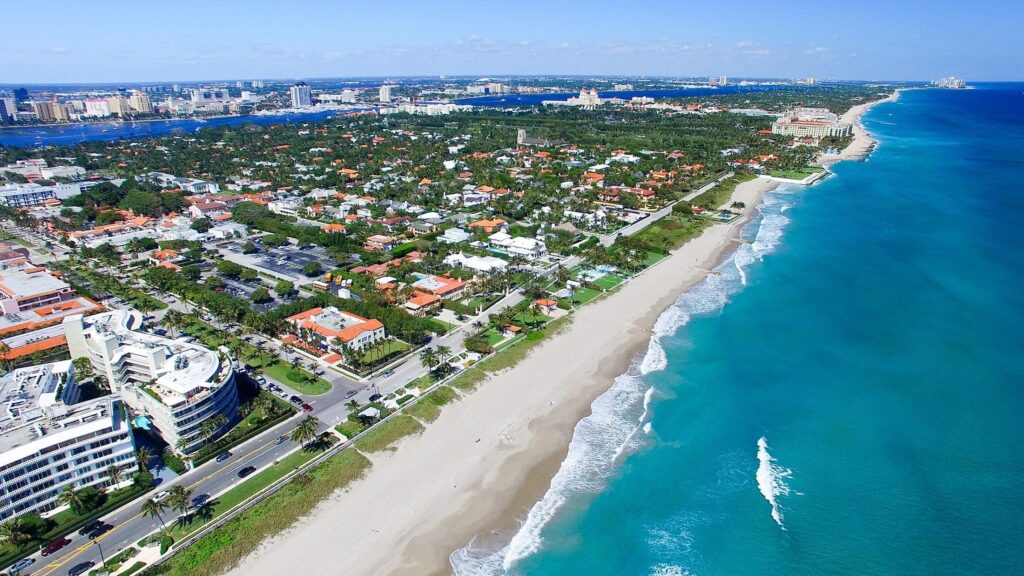
Seattle Homes Sell in Less Than Two Weeks, Other Florida Metros Take More Than 9 Weeks
Analyzing the median number of days it takes for a house to find a buyer is another method to furthwer assess the market’s pace and activity.
“Anyone who has been paying attention to the housing market over the past few years knows that desirable homes sell right away. That’s been true ever since the overall market slowed down after mortgage rates shot up a couple years ago,” said Daryl Fairweather, Chief Economist at Redfin. “Now if a home is still on the market after a few weeks, buyers assume there’s something wrong with it. That’s why it’s so important to price your home to move quickly. Buyers see the days on market and when it starts to tick up, it’s like a scarlet letter.”
Before entering into a contract in August, the average U.S. home was listed for 37 days—six more days than it took a year earlier. However, the outcomes varied greatly based on one’s location within the nation. The average Seattle property sold in just 12 days in August, which was four days slower than a year earlier but still the fastest outcome of the 50 most populous metro areas that we examined.
The remaining five big metro areas with the fastest-selling properties were Oakland, CA (20 days), San Jose, CA (18 days), Indianapolis (16 days), and Warren, MI (17 days).

Top 10 Major Metros With the Fastest Sales
1. Seattle:
- (Median days on market in August: 12)
- (Year-over-year difference: +4 days)
2. Indianapolis:
- (16 days)
- (+4 days)
3. Warren, MI:
- (17 days)
- (+2 days)
4. San Jose, CA:
- (18 days)
- (+5 days)
5. Oakland, CA:
- (20 days)
- (+6 days)
6. Detroit:
- (20 days)
- (+3 days)
7. Boston:
- (20 days)
- (+1 day)
8. St. Louis:
- (21 days)
- (+7 days)
9. Cleveland:
- (21 days)
- (+4 days)
10. Newark, NJ:
- (21 days)
- (-1 day)

Top 10 Major Metros With the Slowest Sales
1. West Palm Beach, FL:
- (Median days on market in August: 79)
- (Year-over-year change: +18 days)
2. Fort Lauderdale, FL:
- (75 days)
- (+23 days)
3. Jacksonville, FL:
- (65 days)
- (+23 days)
4. Austin, Texas:
- (65 days)
- (+11 days)
5. Miami:
- (65 days)
- (+11 days)
6. San Antonio:
- (57 days)
- (+12 days)
7. Phoenix:
- (55 days)
- (+14 days)
8. Nashville, TN:
- (53 days)
- (+8 days)
9. Pittsburgh:
- (50 days)
- (+1 day)
10. Chicago:
- (49 days)
- (No change YoY)

Conversely, properties in West Palm Beach, FL, took an average of 79 days to sell before a buyer was found, which is 18 days longer than a year earlier. West Palm Beach, along with Fort Lauderdale, FL (75 days), Jacksonville, FL (65 days), and Miami (65 days), was one of the four major Florida metro areas where finding a buyer took at least nine weeks.
The surge in newly constructed homes in Florida throughout the last few years to accommodate the demand of those relocating there during the pandemic is one factor contributing to the state’s slower real estate market. Homes are remaining on the market for longer now that inward migration has bottomed off, and rising insurance and HOA dues are further dampening buyer demand. Additionally, recent damage from Hurricane Milton may drastically change some of these trends in the near future.
To read the full report, including more data, charts, and methodology, click here.


