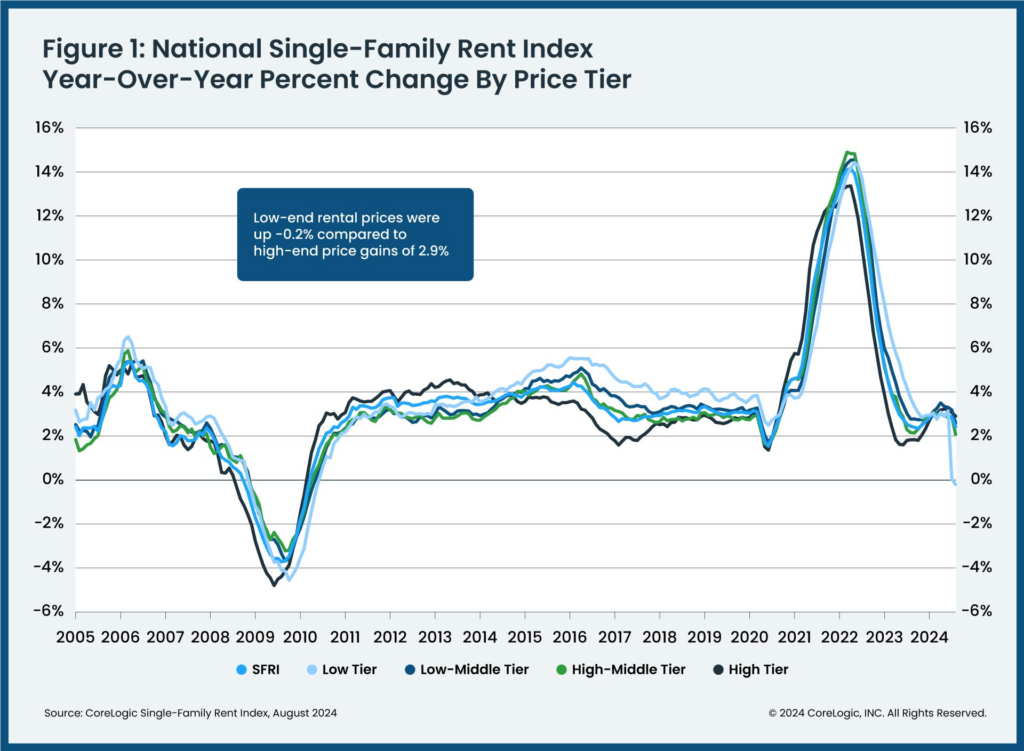
CoreLogic has released the latest Single-Family Rent Index (SFRI), which examines changes in single-family rent prices across the U.S. and in major cities. New data found that although August’s annual growth in U.S. single-family rent was less than 3%, it has increased by 33% from the pandemic’s start.
Expensive coastal metros led the nation in growth, and while Sun Belt markets aren’t as hot as they once were, some of those areas—Miami (55%), Orlando, FL (41%), Phoenix (both 38%), and Tucson, AZ (38%)—have seen notable rises over the previous four years.
“Single-family rent growth slowed in August from both a year and a month ago,” said Molly Boesel, Principal Economist at CoreLogic. “The monthly drop in single-family rents of 0.2% was notable as it was contrary to the typical August increase of 0.3% and therefore points to quickly decelerating single-family rents. However, some metro areas bucked the national trend—the top metros in rent growth in August all had accelerating gains from a year ago.”

Single-Family Rent Growth Sees Notable Drop
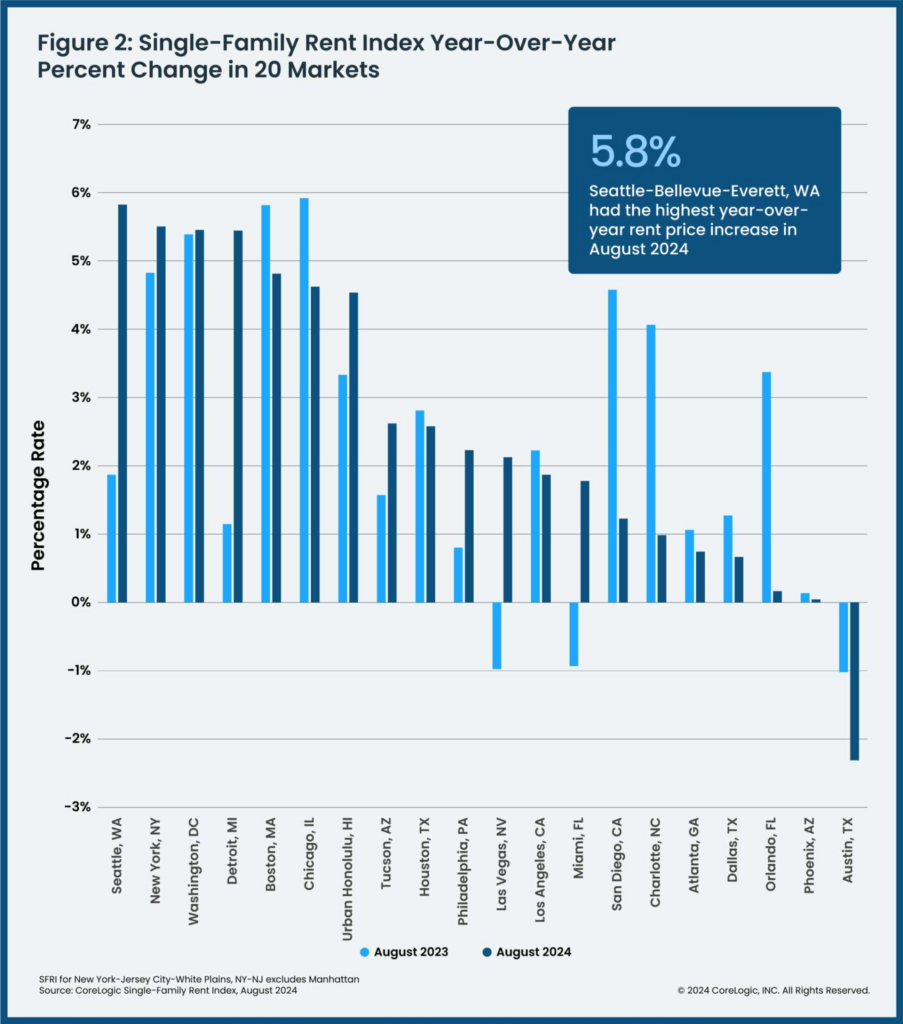
Seven metro regions saw gains of at least 4% gains, and seven of the top 20 core-based statistical area (CBSAs) that CoreLogic measured had median rents over $3,000.
Seattle had the largest year-over-year increase in single-family rents in August 2024 (at 5.8%), followed by New York and Washington, D.C. (both at 5.5%). Rents in Austin, Texas decreased by -2.3% on an annual basis, however there was no change in Phoenix.

Top 10 Metro Areas with the Highest YoY Single-Family Rent Change: August 2024
- Seattle-Bellevue-Everett, WA (YoY rent change: 5.8%)
- New York-Jersey City-White Plains, NY-NJ (5.5%)
- Washington-Arlington-Alexandria, DC-VA-MD-WV (5.5%)
- Detroit-Dearborn-Livonia, MI (5.4%)
- Boston (4.8%)
- Chicago-Naperville-Arlington Heights, IL (4.6%)
- Urban Honolulu, HI (4.5%)
- Tuscon, AZ (2.6%)
- Houston-The Woodlands-Sugar Land, Texas (2.6%)
- Philadelphia (2.2%)
The next CoreLogic Single-Family Rent Index is scheduled to be released on November 21, 2024, featuring data for September 2024.
To read the full report, including more data, charts, and methodology, click here.


