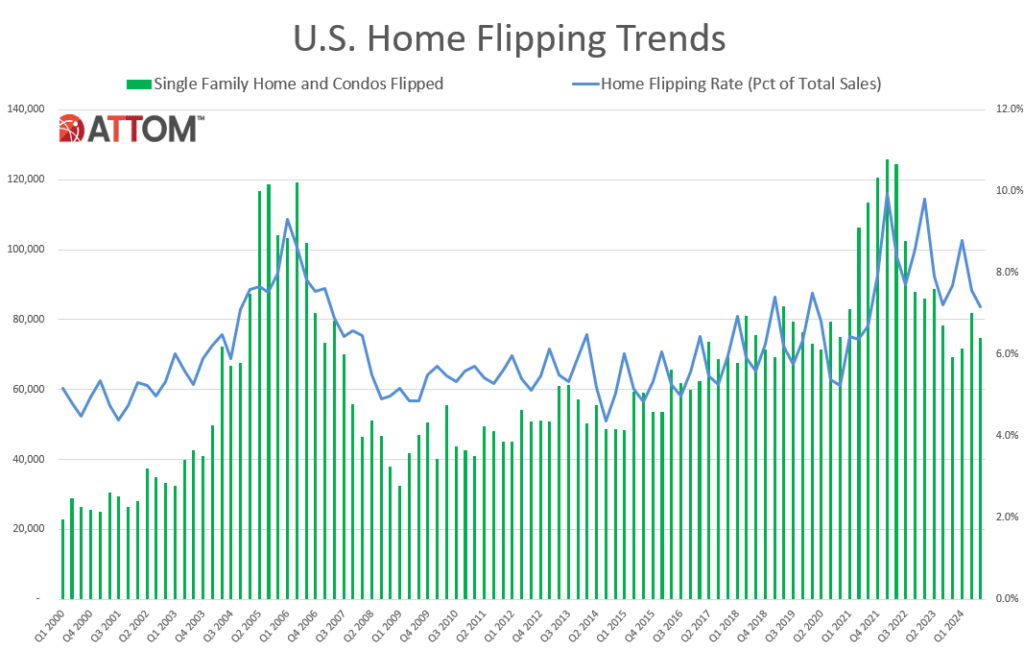
ATTOM has released its Q3 2024 U.S. Home Flipping Report showing that 74,618 single-family homes and condominiums in the U.S. were flipped in Q3 of 2024—representing 7.2%, or one of every 14 home sales, nationwide during the months of July through September of 2024.
The latest portion of flipped properties was down from 7.6% of all sales in the U.S. during Q2 of 2024, extending a common pattern seen during annual spring and summer 2024 buying seasons when other types of home sales spike. The flipping rate returned to the 7.2% level recorded in Q3 of last year. And while the flipping rate followed historical trends, profits turned back downward for investors who buy, renovate and quickly resell homes following a period when their fortunes had been improving.
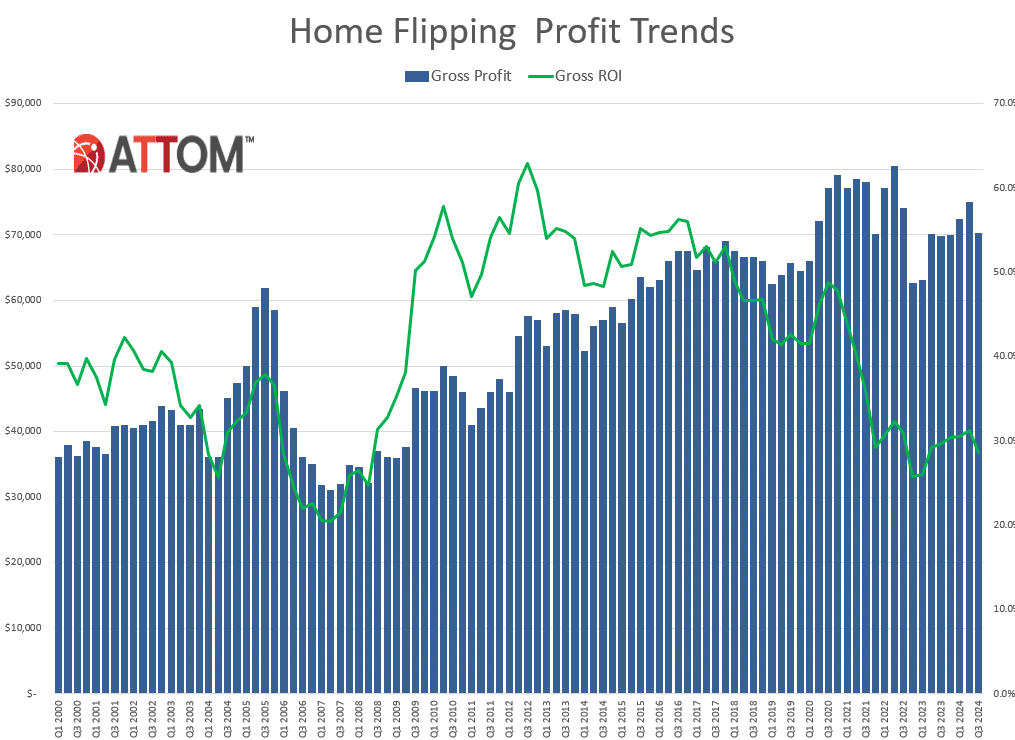
In Q3, home flipping generated on average a 28.7% return-on-investment (ROI) before expenses on homes re-sold during Q3 2024—down from 31.2% in Q2 of 2024 after six straight quarterly increases that had signaled a marked improvement for the flipping industry.
The typical profit margin on homes flipped during Q3 2024–based on the difference between the median purchase and median resale price for home flips–slid down to only half of the mid-50% peak hit in 2016. It also stayed withing a range that could easily be wiped out by carrying costs that include renovation expenses, mortgage payments and property taxes, exposing again the struggles that U.S. home flippers are having in turning healthy profits. Gross profits on typical flips around the country decreased to approximately $70,000—down roughly $5,000 from Q2 2024, and $10,000 from highs reached two years ago, although still up slightly from Q3 2023.
“Home flippers just can’t seem to shake the doldrums. After more than a year when things were getting better, they turned notably worse again over the summer,” said Rob Barber, CEO for ATTOM. “One quarter’s worth of numbers isn’t enough to make any grand statements about another downturn. The next six months should speak more to that, especially amid an ongoing tight housing market that should work in their favor. But as interest rates remain double what they were a few years ago and inflation keeps raising renovation costs, investors continue to have a tough time making the kind of profits that would lure more into the game.”
Home-Flipping Rates Dip Quarterly
Home flips as a portion of all home sales decreased from Q2 to Q3 of 2024 in 115 of the 183 metropolitan statistical areas (MSAs) around the U.S. with enough data to analyze (62.8%), although they were still up annually in 95, or 51.9% of those markets. Measured against the same period of 2023, a majority of flipping rates changed by less than one percentage point.
Among the metro areas analyzed, the largest flipping rates during Q3 of 2024 were found in:
- Warner Robins, Georgia (flips comprised 22.7% of all home sales)
- Macon, Georgia (16.8%)
- Atlanta, Georgia (13.6%)
- Columbus, Georgia (12.8%)
- Memphis, Tennessee (12.7%)
Tracking Historical Flipping Trends
Aside from Atlanta and Memphis, the highest Q3 flipping rates among metro areas with a population of at least one million were reported in:
- Birmingham, Alabama (11%)
- Phoenix, Arizona (10.7%)
- Tampa, Florida (10%)
Conversely, the smallest home-flipping rates were reported in:
- Seattle, Washington (3.5%)
- Des Moines, Iowa (3.7%)
- Honolulu, Hawaii (3.8%)
- Portland, Maine (3.9%)
- Madison, Wisconsin (4%)
Flipping Returns Down in Majority of the U.S.
The median $315,250 resale price of homes flipped nationwide in Q3 of 2024 generated a gross profit of $70,250 above the median investor purchase price of $245,000. That resulted in a typical 28.7% gross profit margin before expenses in Q3 of 2024, down more than two points from 31.2% in Q2 of 2024. It also was down from 29.7% in Q3 of last year.
Profit margins decreased from Q2 to Q3 of this year in 106 of the 183 metro areas analyzed (57.9%) and were down annually in 105 of those markets (57.4%).
Metro areas with the biggest quarterly declines in typical profit margins during Q3 2024 included:
- Salisbury, Maryland (ROI down from 129.8% in Q2 of 2024 to 61.8% in Q3 of 2024)
- South Bend, Indiana (down from 89.4% to 36.4%)
- Gainesville, Florida (down from 64% to 20%)
- Peoria, Illinois (down from 78.2% to 36.4%)
- Youngstown, Ohio (down from 54.1% to 20%).
Metro areas with a population of at least one million, and the largest quarterly profit-margin drop-offs were reported in:
- Buffalo, New York (ROI down from 100% in Q2 of 2024 to 73.5% in Q3 of 2024)
- Honolulu, Hawaii (down from 24.4% to 5.9%)
- Tulsa, Oklahoma (down from 59.1% to 40.8%)
- San Jose, California (down from 26.8% to 12.1%)
- Pittsburgh, Pennsylvania (down from 115.3% to 101.8%)
Profit Margins Suffer
The recent fallback resulted in typical gross profit margins of less than 30% in 80, or four of every 10 metros with enough data to analyze in Q3 of 2024. That was up from 73 of the same group of metro areas in Q2 and 69 a year earlier. Typical profit margins surpassed 50% in Q3 of 2024 in only about one-third of the areas reviewed.
Markets reporting the largest gross ROI for typical home flips completed during Q3 of 2024 again were concentrated in lower-priced areas, especially in the Northeast and South. They were led by the following markets:
- Ocala, Florida (141.5% return)
- Pittsburgh, Pennsylvania (101.8%)
- Scranton, Pennsylvania (100%)
- Flint, Michigan (98.9%)
- Columbus, Georgia (93.8%)
Aside from Pittsburgh, the largest investment returns in Q3 among metro areas with a population of at least one million were found in:
- Cleveland, Ohio (78.3%)
- Rochester, New York (78.2%)
- Baltimore, Maryland (78%)
- Richmond, Virginia (75%)
Metro areas with a population of at least one million and the lowest ROI on typical home flips in Q3 2024 were reported in:
- Austin, Texas (4.5%)
- Honolulu, Hawaii (5.9%)
- Houston, Texas (6.2%)
- San Antonio, Texas (6.6%)
- Dallas, Texas (6.9%)
Higher-End Markets Continue to Flourish
The largest raw profits on median-priced home flips in Q3 of 2024, measured in dollars, were concentrated in areas of the West, South and Northeast regions where typical resale prices mostly topped $400,000. Eight of the top 10 fell into that category, led by:
- San Francisco, California (typical gross profit of $234,000 on a median resale value of $1.1 million)
- New York, New York ($170,000 profit on a median resale value of $600,000)
- Washington, D.C. ($170,000 profit on a median resale value of $545,000)
- Salisbury, Maryland ($168,016 profit on a median resale value of $440,000)
- Boston, Massachusetts ($160,000 profit on a median resale value of $625,000)
The South continued to dominate the low end of the spectrum, with 13 of the 15 lowest raw profits on median-priced transactions during the third quarter. Most came in areas with median resale prices below $300,000, with the smallest reported in:
- Warner Robins, Georgia (typical $3,500 profit on a median resale value of $268,500)
- Killeen, Texas ($5,302 profit on a median resale value of $240,627)
- Boise, Idaho ($7,936 profit on a median resale value of $439,469)
- Lubbock, Texas ($12,372 profit on a median resale value of $200,688)
- Amarillo, Texas ($14,852 profit on a median resale value of $170,852)
Click here for more on ATTOM’s Q3 home flipping report.