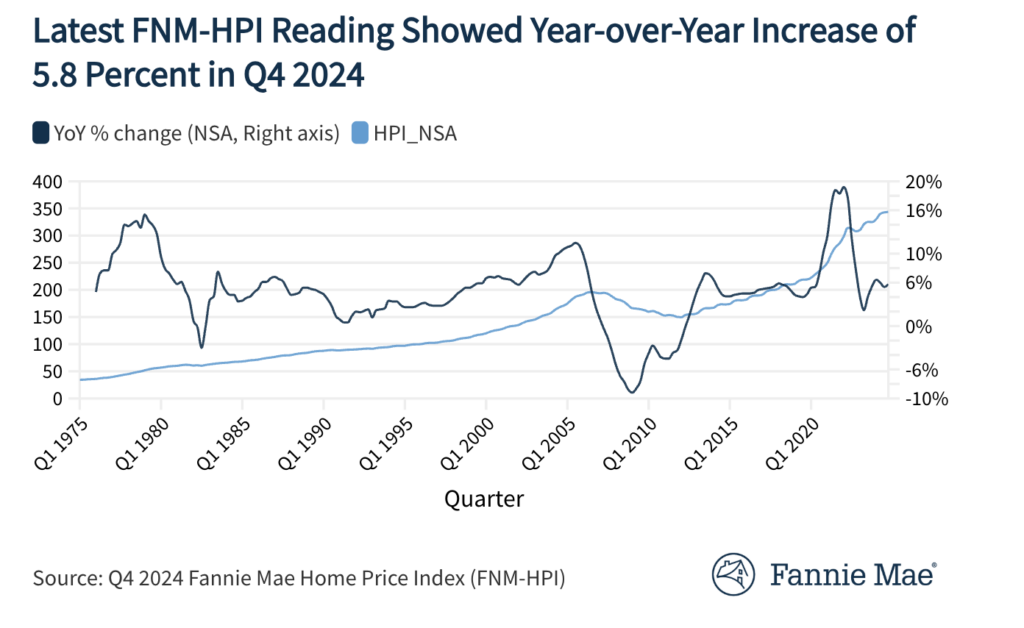
The most recent reading of the Fannie Mae Home Price Index (FNM-HPI) showed that single-family home prices climbed 5.8% from Q4 2023 to Q4 2024, accelerating from the downwardly revised annual growth rate of 5.4% in the previous quarter. The average quarterly price change for all single-family homes in the U.S.—excluding condos—is measured by the FNM-HPI, a national repeat-transaction home price index.
“Year-over-year home price growth accelerated in the fourth quarter, following back-to-back quarters of deceleration,” said Mark Palim, SVP and Chief Economist at Fannie Mae. “Inventories of existing homes for sale have improved from a year ago but remain historically low, due largely to the so-called ‘lock-in effect.’ Since the beginning of October, mortgage rates have rebounded after bottoming out around 6.1% and are now inching closer to a new psychological barrier, the 7% threshold. The higher mortgage rate environment is not only hurting affordability, but it’s also exacerbating the lock-in effect by further reducing homeowners’ incentive to move.”

Examining Q4’s YoY Increase and What it Means for 2025
Compared to the downwardly corrected 1.2% growth rate in Q3 2024, property prices increased a seasonally adjusted 1.7% in Q4 2024. In Q4 2024, housing prices climbed by a meager 0.3% on a non-seasonally adjusted basis.
“The housing market in 2025 faces a difficult balancing act, with a notable decline in mortgage rates likely needed to help unwind the lock-in effect and thaw the supply of existing homes for sale,” Palim said. “However, we believe such a decline would likely jumpstart demand from potential first-time homebuyers currently waiting to purchase, which could lead demand to outpace any improvement in supply, further exacerbating already-high home prices and purchase affordability.”
In order to generate seasonally adjusted and non-seasonally adjusted national indices that are typical of the entire nation and intended to act as indicators of general single-family house price trends, the FNM-HPI is created by combining data at the county level. Beginning in Q1 1975 and continuing until the most recent quarter, Q4 2024, the FNM-HPI is made publicly available nationwide as a quarterly series. In the first month of every new quarter, Fannie Mae releases the FNM-HPI in the middle of the month.
Click here to learn more about the FNM-HPI, including the Q4 2024 data file and a discussion of the methodology used in the report.


