According to Zillow‘s most recent market report, rented single-family homes are currently the most notable item on the real estate market, with prices 20% higher than those of a typical multifamily apartment. That is the biggest difference Zillow has ever seen.
While builders’ response has kept multifamily rent growth steady for several months and stubbornly high mortgage rates are limiting buyer demand and home value increases, detached single-family home rentals are still rising at an accelerating rate.
Key Findings:
- Rents for single-family homes are up a estimated 41% over pre-pandemic norms, while multifamily rents have risen 26% in that time.
- Concessions are being offered on two out of every five rental properties on Zillow, another record.
- For-sale inventory continues to recover, but is still 25% below pre-pandemic norms.
“Right now, more multifamily units are hitting the market than at any time in the past 50 years, but detached homes aren’t seeing the same surge in construction,” said Skylar Olsen, Chief Economist at Zillow. “We’ve also got the large millennial generation wanting to move into a larger space. High and unpredictable mortgage rates and hefty down payments are pushing some to rent that lifestyle instead of buying it. Similarly discouraged, some homeowners may return to the market and sell to capitalize on record prices, rather than continue to wait for lower rates.”
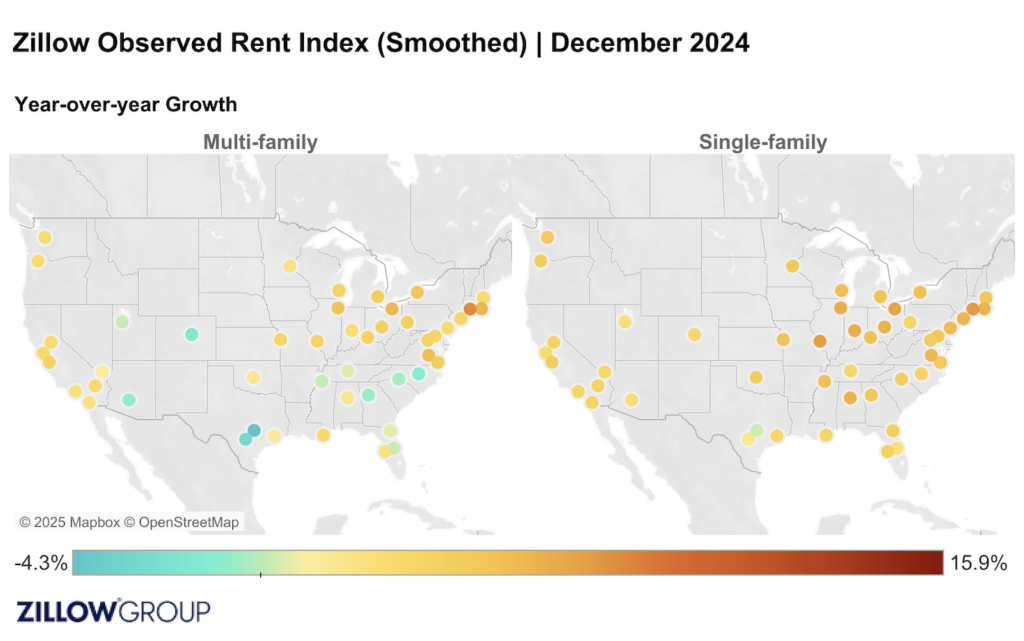
In terms of yearly growth, apartment rentals are increasing at a comparatively steady 2.4% annually, which is somewhat less than the mid-3% rise observed in 2018 and 2019, while detached home rents are up 4.4%, which is comparable to their trajectory prior to the pandemic. In the meantime, owned home value growth has leveled out at 2.6% annually, down from 5.2% in December 2019.
Rentals for single-family homes have increased 41% since the pandemic began, while rentals for multifamily homes have increased 26%. The biggest price differential among the 50 major U.S. metro areas is found in Salt Lake City, where single-family rentals are 59% more expensive than multifamily units. Pittsburgh, whose single-family building has increased dramatically over the last five years, had a low 14% differential, while Detroit had the least delta percentage at 9%.

Overview of Rent Affordability:
The median household would spend 29.3% of their income on a new rental in December. That is an estimated 0.1ppts higher than the month prior and 0.2ppts than last December. The pre-pandemic share of median household income spent on rent was 26.9%.
The income needed to afford rent increased by 3.4% year-over-year in December to $78,592. Since pre-pandemic, the income needed to afford rent has increased by 33.4%.
The most affordable metro areas for rents were:
- Austin, Texas (19.6%)
- Minneapolis (20.1%)
- St. Louis (20.2%)
- Salt Lake City (20.2%)
- Milwaukee (20.4%)
The least affordable metro areas for rents were:
- Miami (40.9%)
- New York (38.8%)
- Los Angeles (36.7%)
- San Diego (33.3%)
- Riverside, CA (33.2%)
Some of the metros listed above… no surprise there, right? California metros are notoriously expensive, while tourist spots like the “Big Apple” and Miami have also historically boasted exceedingly high rent rates.

Measuring Single-Family Rents:
Single-family rents are now up 4.4% from last year. The typical asking rent for single-family homes was $2,174 in December, up 0.1% month-over-month. Since the beginning of the pandemic, single-family rents have increased by 40.6%.
Overall, single-family rents fell, on a monthly basis, in 20 major metro areas. The largest monthly drops in single-family rents were in:
- Salt Lake City (-1.2%)
- Boston (-0.8%)
- Buffalo, NY (-0.6%)
- Denver (-0.5%)
- Virginia Beach, VA (-0.4%)
Single-family rents rose from year-ago levels in all of the 50 largest metro areas. Annual single-family rent increases were highest in:
- Hartford, CT (7.7%)
- St. Louis (7.6%)
- Cleveland (7.4%)
- Chicago (6.8%)
- Indianapolis (6.6%)

Examining Multifamily Rents:
Multifamily rents are now up 2.4% from last year. The typical asking rent for multifamily homes was $1,812 in December, down 0.3% month-over-month. Since the beginning of the pandemic, multifamily rents have increased by 26.2%.
Multifamily rents fell, on a monthly basis, in 35 major metro areas. The largest monthly drops in multifamily rents were in:
- Memphis, TN (-1.4%)
- Denver (-1.4%)
- Birmingham, AL (-0.8%)
- San Antonio (-0.7%)
- Portland, OR (-0.7%)
Conversely, multifamily rents rose from year-ago levels in 42 of the 50 largest metro areas. Annual multifamily rent increases were highest in:
- Hartford, CT (8.3%)
- Cleveland (6.3%)
- Providence, RI (6.3%)
- Richmond, VA (5.8%)
- Chicago (5.4%)

Concessions Rise as Rents Remain “Sticky”
Multifamily rents are proving to be sticky, even with the overall increase in apartment development. Over the previous year, annual rent growth has been rather steady, hovering around 2%.
Instead, in an effort to attract tenants, property managers are increasingly using concessions. Now, 41% of all rental listings on Zillow include these deal sweeteners, such free parking or months of rent, which is another new high. For more information, see Zillow’s Rental Market Report. The largest generation in the US, millennials, are delaying home ownership by renting for a longer period of time. According to Zillow’s most recent Consumer Housing Trends Report, the median age of renters increased from 33 to 42 in 2024.
Additionally, inventory is still moving in the direction of long-term pre-pandemic norms. December saw just under 1 million properties on the market countrywide, which is more than any December since 2019. Compared to the record deficit of 51% in February 2022 or the 37% shortage in January 2024, inventory is currently 25% below the 2018–2019 norms for this time of year. There will be less competition for the newly listed homes and slower price growth in the future if buyers have more options.
If all goes well, the recent trend of sellers going back into the market—some perhaps not believing that mortgage rates will fall soon enough to help their own purchasing circumstances—will continue to pick up steam in the next year.
There are now more homes for sale in 10 of the 50 biggest major metro areas than there were at this time of year prior to the pandemic. Although Denver is included, builders have been better able to meet demand in the South, Florida, and Texas, which make up the majority of those metro areas.
Those who are thinking about purchasing a home in 2025 should ensure that their credit is in excellent standing now and, if at all possible, begin taking action to raise their score.
To read the full report, including more data, charts, and methodology, click here.


