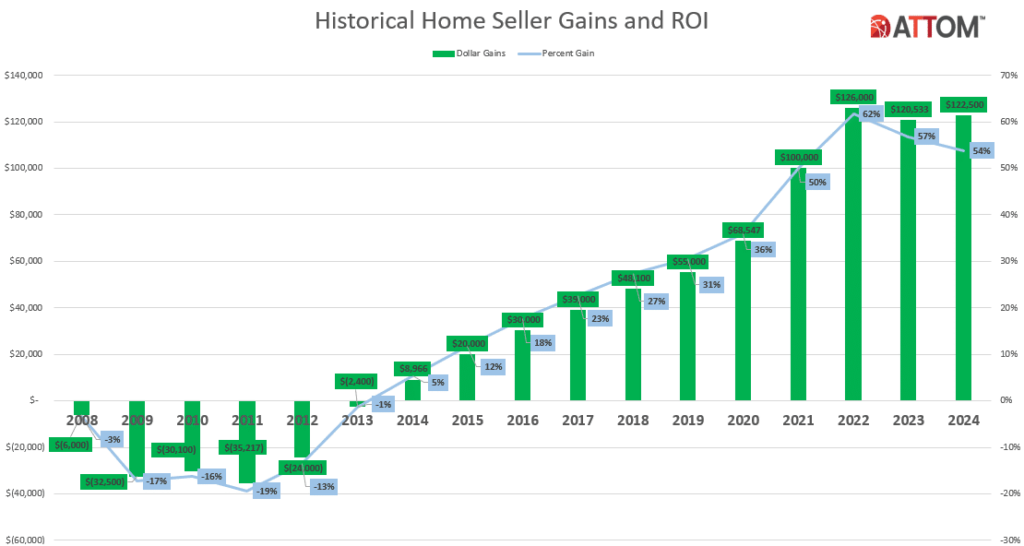
ATTOM has released its Year-End 2024 U.S. Home Sales Report, which shows that home sellers made a $122,500 profit on typical sales nationwide in 2024, generating a 53.8% return-on-investment (ROI). But even as both measures remained near record levels, and home prices kept rising around the country, the profit margin on median-priced sales nationwide decreased from 56.9% from 2023. The drop-off marked the second straight annual decline—a pattern of consecutive downturns that hadn’t happened since the aftermath of the Great Recession in the late 2000s.
While the gross profit on median-priced single-family home and condo sales did inch up approximately $2,000 from 2023, the typical profit margin stood eight percentage points below a peak hit in 2022. The downward investment-return trend continued despite the median national home price rising 5% to another annual record of $350,000. Margins fell back as the increase in home values failed to keep up with larger price spikes recent sellers had been paying when they originally bought their homes.
“After a weak 2023, the U.S. housing market mostly rebounded nicely in 2024. Prices went back up at a healthy clip and homeowners continued to make some of the best profits on sales in the past 25 years. The renewed shine, however, didn’t come without a bit of tarnish as margins took another turn for the worse,” said Rob Barber, CEO at ATTOM. “Amid the generally good news, that’s something worth following closely in 2025.”
The price-and-profit picture, while mixed, reflected an ongoing housing market boom that has continued for 13 consecutive years. Last year’s scenario emerged as buyers buoyed by rising wages, a strong investment market and mostly receding mortgage interest rates competed for a historically tight supply of homes. Nevertheless, the resulting price gains weren’t quite enough to push profits upward.
Among the 127 metropolitan statistical areas (MSAs) with a population greater than 200,000 and sufficient sales data, sellers in more expensive markets around the U.S. generally reaped the highest returns on investment in 2024. Geographically, the Northeast, South and West regions led the way with 29 of the 30 highest ROIs, led by:
- San Jose, California (105.8% return on investment)
- Knoxville, Tennessee (94.3%)
- Ocala, Florida (87.1%)
- Seattle, Washington (85.6%)
- Scranton, Pennsylvania (85%)

National Median Price Rises
After a weak annual gain of just 1.1% in 2023, the U.S. median home price increased another 4.9% in 2024, hitting the latest all-time high of $350,000. The typical 2024 price was almost 2.5 times the nationwide median in 2011, a point in time right before the housing market began recovering from the Great Recession. Amid the tight supply of properties for sale, median values went up last year in 115, or 91%, of the 127 MSAs around the U.S. reviewed for this report. Those with the biggest year-over-year increases were found in:
- Evansville, Indiana (median up 13.4%)
- Augusta, Georgia (up 13.2%)
- Albany, New York (up 12.3%)
- Fort Wayne, Indiana (up 12.2%)
- Scranton, Pennsylvania (up 12.1%)
The largest median-price increases in metro areas with a population of at least one million in 2024 came in:
- Hartford, Connecticut (up 11.1%)
- New York, New York (up 9.6%)
- Rochester, New York (up 9.5%)
- Detroit, Michigan (up 9.5%)
- Providence, Rhode Island (up 9.4%)
Metro areas where median prices dropped most in 2024 were reported in:
- Birmingham, Alabama (down 8.3%)
- Ocala, Florida (down 5.9%)
- Fort Myers, Florida (down 4.3%)
- Lakeland, Florida (down 2.8%)
- Sarasota, Florida (down 2.7%)
Profit Margins Decrease Most in the South
Profit margins on typical home sales fell from 2023 to 2024 in 93 of the 127 metro areas with sufficient data to analyze for investment returns (73%). The 10 largest decreases in investment returns were all reported in the Southern portion of the U.S., led by:
- Fayetteville, Arkansas (ROI down from 71.9% in 2023 to 51.3% in 2024)
- Ocala, Florida (down from 105.7% to 87.1%)
- Sarasota, Florida (down from 80.6% to 64.6%)
- Chattanooga, Tennessee (down from 80.6% to 65.9%)
- Crestview-Fort Walton Beach, Florida (down from 60.1% to 45.9%)
The largest ROI losses from 2023 to 2024 in metro areas with a population of at least one million were found in:
- Birmingham, Alabama (ROI down from 44.3% to 33.5%)
- Tampa, Florida (down from 80% to 69.8%)
- San Antonio, Texas (down from 34.4% to 26.4%)
- Austin, Texas (down from 46.5% to 39.5%)
- Portland, Oregon (down from 70% to 63.6%)
The biggest increases in investment returns from 2023 to 2024 came in:
- Syracuse, New York (ROI up from 56% to 69.3%)
- Rochester, New York (up from 61.9% to 72.3 percent)
- Evansville, Indiana (up from 34.6% to 44.7%)
- Cleveland, Ohio (up from 51.6 % to 61.2%)
- Akron, Ohio (up from 50.3% to 59.2%).
Aside from Rochester and Cleveland, metro areas with a population of at least one million and the best increases in profit margins in 2024 included:
- Hartford, Connecticut (up from 67.6% to 75%)
- Buffalo, New York (up from 75.6% to 82.6%)
- San Jose, California (up from 99.9% to 105.8%)
Where Are Sellers Reaping Gross Profits Above $100,000?
Despite the decline in profit margins across much of the country, gross profits on median-priced home sales in 2024 still topped $100,000 in 79, or 62%, of the metro areas with sufficient data to analyze. The east and west coasts had 18 of the top 20 gross profits last year, led by San Jose, California ($782,750); San Francisco, California ($500,000); San Diego, California ($372,000); Los Angeles, California ($366,500); and Seattle, Washington ($332,000).
The 20 smallest gross profits in 2024 were reported in the South and Midwest, reflecting lower home prices in many parts of those regions. The lowest gross profits were found in:
- McAllen, Texas ($42,212)
- Peoria, Illinois ($43,500)
- Baton Rouge, Louisiana ($45,180)
- New Orleans, Louisiana ($46,750)
- Birmingham, Alabama ($50,171)
Homeownership Tenure on the Rise
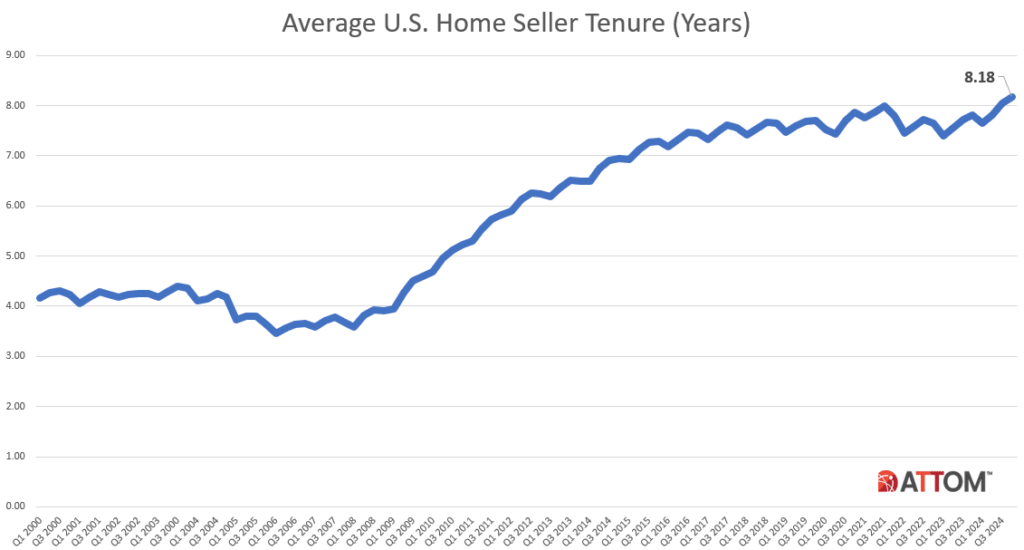
Homeowners in the U.S. who sold in Q4 of 2024 had owned their homes an average of 8.18 years, the longest tenure since at least 2000. The latest figure was up from 8.04 years in Q3 of last year and from 7.8 years in Q4 of 2023. Average seller tenures were up, year-over-year, in 74, or 72%, of the 103 metro areas with a population of at least 200,000 and sufficient data. The biggest increases in average seller tenure from Q4 of 2023 to Q4 of 2024 were in:
- Eureka, California (up 19%)
- Sarasota, Florida (up 16%)
- Bremerton, Washington (up 14%)
- Ventura, California (up 11%)
- Chico, California (up 10%)

The longest tenures for home sellers in Q4 of 2024 were found in:
- Barnstable, Massachusetts (13.6 years)
- Bridgeport, Connecticut (13.23 years)
- New Haven, Connecticut (13.05 years)
- Ventura, California (12.85 years)
- Hartford, Connecticut (12.69 years)
Click here for more on ATTOM’s Year-End 2024 U.S. Home Sales Report


