According to a new study by ATTOM of first quarter 2025 housing data, homeowners, on average, made a 50.2% profit selling single-family homes and condos during Q1 of the year—down 3.2 percentage points from the previous quarter, and down 4.8 percentage points from Q1 of 2024.
The national median profit margin for home sales has declined slightly almost every quarter since the summer of 2022, but it still remains above pre-pandemic levels.
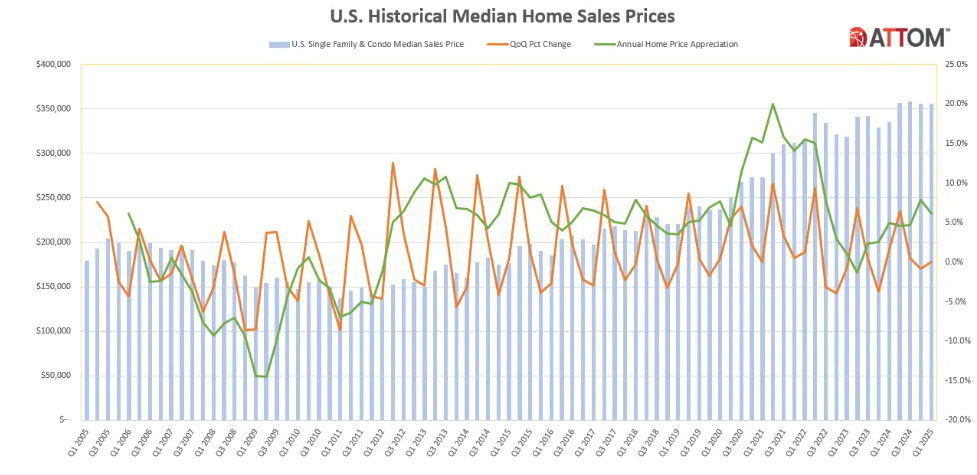
The national median home sale price—whose historic peak was $358,000 in Q3 of 2024—has held steady for the last two quarters at $355,000. However, the median raw profit that sellers made on their homes dropped about 4% from about $124,000 in Q4 of 2024 to $119,000 in Q1 of 2025.
“Sellers may not be enjoying quite the same windfall they were a few years ago, but by historical standards, profits are strong, both in terms of margins and raw dollar value,” said Rob Barber, CEO for ATTOM. “The first quarter also tends to be the weakest of the year, so don’t be surprised to see profits regain ground during the summer months.”
Where Are Profit Margins Slipping?
Compared to Q4 of 2024, typical profit margins dropped in 99 (77%) of the 128 metropolitan statistical areas that had at least 1,000 home sales during Q1 of 2025. Typical profit margin is the percent difference between the median purchase price and median resale price for homes in an area. Compared to the same time last year, typical profit margins fell in 106 (83%) of the 128 metro areas.
The biggest year-over-year decreases in typical profit margins during Q1 of 2025 came in:
- Punta Gorda, Florida (down from 106.3% to 69.2%)
- Ocala, Florida (down from 99.9% to 66.7%)
- Deltona, Florida (down from 81.6% to 54%)
- Bakersfield, California (down from 81.1% to 58.9%)
- Spartanburg, South Carolina (down from 49.4% to 29.6%)
The largest year-over-year increases in typical profit margins for Q1 of 2025 were reported in:
- Toledo, Ohio (up from 27.8% to 44.7%)
- Birmingham, Alabama (up from 24.9% to 35.1%)
- Canton, Ohio (up from 43.8% to 53.1%)
- Syracuse, New York (up from 56.8% to 62.3%)
- Youngstown, Ohio (up from 64.7% to 70%)
Among metro areas with populations over one million, the biggest year-over-year decreases in typical profit margins were reported in:
- San Jose, California (down from 105% to 88.8%)
- Tampa, Florida (down from 73.9% to 59.1%)
- Fresno, California (down from 75% to 60.8%)
- San Francisco, California (down from 78.3% to 64.3%)
- Jacksonville, Florida (down from 59.6% to 47.4%)
And among those largest metro areas, including Birmingham, Alabama, the biggest year-over-year improvement in typical sales profit margins came in:
- Chicago, Illinois (up from 41.9% to 45.2%)
- Buffalo, New York (up from 79.1% to 82.2%)
- Cleveland, Ohio (up from 52.9% to 55.4%)
- Virginia Beach, Virginia (up from 37.8% to 39.8%)
Investment Returns on the Rise
Despite the profit margins shrinking nationwide, home sellers are still seeing comparatively high returns on their investments. Of the 128 metro areas in our analysis, 77 (60%) had typical sales profit margins at or above 50%.
Among metro areas with at least one million residents, the highest typical profit margins were reported in:
- San Jose, California (88.8%)
- Buffalo, New York (82.2%)
- Seattle, Washington (75.3%)
- Providence, Rhode Island (74.1%)
- Boston, Massachusetts (73.9%)
Of the largest metro areas, the lowest typical profit margins were found in:
- New Orleans, Louisiana (18.1%)
- San Antonio, Texas (24.5%)
- Dallas, Texas (29.7%)
- Austin, Texas (32.7%)
- Houston, Texas (35%)
Raw Profits Hold Steady
Compared to the same time last year, the national typical raw profit on home sales—the median dollar amount difference between how much sellers purchased homes for and how much they sold them for—stayed essentially the same at just below $119,000.
However, some metro areas saw significant changes in the typical raw profit from sales. Of the 128 metro areas analyzed, 74 (58%) saw typical raw profits drop year-over-year.
Among metro areas with populations over one million, the biggest year-over-year decrease in raw profit were found in:
- New Orleans, Louisiana (down 27.6%)
- Dallas, Texas (down 17.8%)
- Tampa, Florida (down 15%)
- Jacksonville, Florida (down 14.2%)
- Austin, Texas (down 13%)
Still, 79 (62%) of the 128 metro areas had typical raw profits that exceeded $100,000, with coastal cities, particularly in California, leading the way. The metro areas with the largest typical raw profits in Q1 of 2025 were:
- San Jose, California ($710,000)
- San Francisco, California ($411,000)
- San Diego, California ($360,000)
- Los Angeles, California ($340,000)
- Oxnard, California ($317,050)
The metro areas with the smallest typical raw profits were found in:
- New Orleans, Louisiana ($38,000)
- Baton Rouge, Louisiana ($42,500)
- Springfield, Missouri ($44,936)
- Toledo, Ohio ($49,689)
- Birmingham, Alabama ($50,800)
Median Home Values Remain High
The national median home sales price hit a record high of $358,000 in Q3 of 2024. Since then, it has dropped slightly—about 0.8%—but is still 6% higher than it was at the end of Q1 in 2024. The typical sales value grew year-over-year in 85% of the metro markets analyzed, and quarter-over-quarter in 26% of the metro markets.
The metro areas that saw the largest year-over-year increase in typical sales prices were found in:
- Syracuse, New York (up 18.8% to $214,950)
- Toledo, Ohio (up 18.5% to $160,000)
- Kansas City, Missouri (up 16.1% to $290,203)
- Louis, Missouri (up 14.3% to $240,000)
- Dayton, Ohio (up 14.3% to $200,000)
The metro areas with the biggest year-over-year decreases in typical sales prices were:
- Cape Coral, Florida (down 9% to $355,000)
- Sarasota, Florida (down 6% to $430,278)
- Boise City, Idaho (down 5.2% to $448,941)
- Punta Gorda, Florida (down 4.5% to $315,000)
- Tampa Bay, Florida (down 3.4% to $350,000)
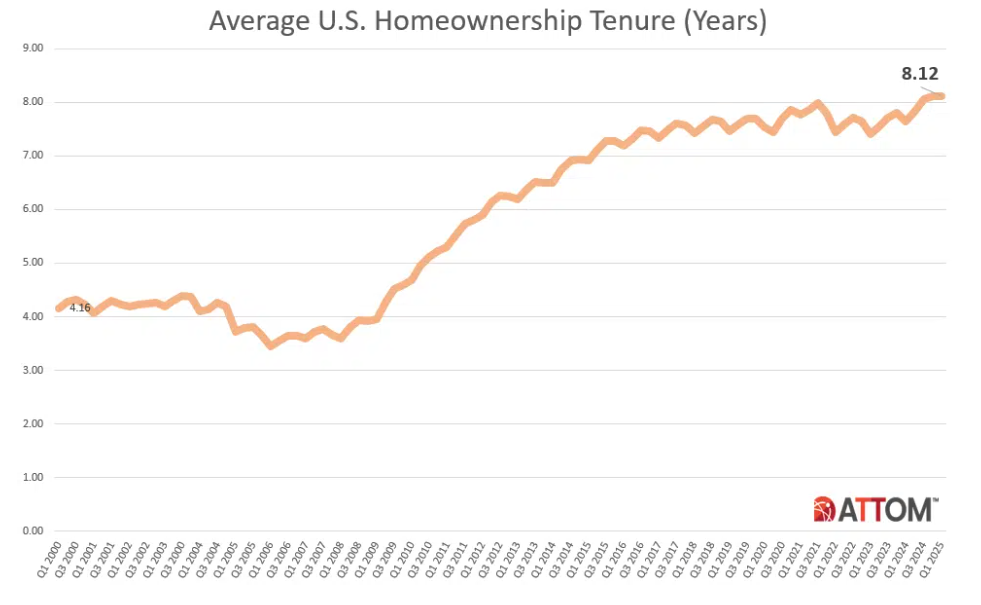
Owners Play the Waiting Game
The average amount of time owners hold onto a home before selling it has been steadily increasing since 2006. For homes sold in Q1 of 2025, the average amount of time between purchase and sale was 8.12 years, the same amount of time as in Q4 of 2024 but almost six months longer than homes sold in Q1 of 2024.
The average length of ownership between sales increased quarter-over-quarter in 59 (52%) of 114 metro areas with sufficient data to analyze. Year-over-year, the average length of ownership increased in 96 metro areas (84%).
The metro areas with the longest ownership tenure for homes sold in Q1 of 2025 were:
- Barnstable, Massachusetts (14.8 years)
- New Haven, Connecticut (13.1 years)
- Eureka, California (12.9 years)
- Bridgeport, Connecticut (12.6 years)
- Torrington, Connecticut (12.2 years)
The metro areas with the shortest average ownership tenures were found in:
- Provo, Utah (6.2 years)
- Crestview, Florida (6.8 years)
- Oklahoma City, Oklahoma (6.9 years)
- Austin, Texas (6.9 years)
- Kansas City, Missouri (7 years)
Click here for more on ATTOM’s analysis of Q1 U.S. home sales.