

Americans are big homebodies: we spend an average of 18 hours and 12 minutes at home each day. Just 7.8% of Americans relocated in 2023, the lowest moving rate since the 1940s. Of course, the more you stay home, the more things you see that you want to change. Hence the surge in home improvements, now Instant Roofer has a study of the metros where home improvements are least affordable.
Key Takeaways
- The number of home improvement projects increased 22% in less than five years, from 113 million in 2019 to 138 million in 2023.
- S. home improvement spending has increased 60% since 2019 (from $494B to $790B).
- Americans now spend an average of 1.7% of their household income on routine home maintenance and 11.3% on bigger home improvement projects.
- Routine maintenance costs hit Miami homeowners hardest at 2.4% of the average household income. Milwaukee is the most affordable metro for routine maintenance, with residents spending just 1.1% of their household income.
- Phoenix and Denver homeowners invest most heavily in home improvements, dedicating over 11% of the average household income. Households in Detroit invest the least (6.4%), partly due to their high propensity for DIY.
Instant Roofer wanted to discover where in the U.S. are home improvements the least affordable. To do that, they analyzed the latest American Housing Survey, which collects data from the top 15 metros in the U.S., plus a selection of other rotating metros. Then they looked at 20 metros which were included in both the 2019 and 2023 survey releases.
For Routine Maintenance, Miami Takes Top Spot
Routine home maintenance, things like gutter cleaning and basic HVAC maintenance, now costs American households an average of $1,356 per year, 1.7% of a typical household income. That’s up from 1.4% in 2019, when the average spend was $931.
For routine home maintenance, Miami, Los Angeles, and New Orleans emerge as the least affordable cities. Maintenance in Miami averages 2.4% of household income—that’s nearly double what homeowners pay in more affordable metros like Milwaukee (1.1%) and Denver (1.2%).
And the affordability gap is widening. In those three least-affordable cities, home maintenance now takes up 0.6 percentage points more of people’s income than it did in 2019. Meanwhile, in more affordable cities like Milwaukee and Denver, it’s only risen by 0.15 percentage points. Only one city, Boston, has seen affordability improve since 2019.
Phoenix Spends the Most on General Home Improvements
General home improvements are upgrades to a house: adding a swimming pool, for instance, or installing a security system. They also include bigger jobs, like replacing the roofing or replacing a driveway.
In total, Americans spent $790 billion on home improvements in 2023. That works out to a little over $9,000 per household (11.3% of the average household income), and is a great increase from 2019’s $494 billion spend (9% of that year’s average household income).
Interestingly, the cities that dedicate the most amount of money towards home improvements are the ones where routine maintenance is more affordable. Households in Phoenix, Denver, and Milwaukee allocate over 11% of their household income to home improvements. while in Detroit, only 6.4% of a household’s income goes towards home improvements.
The national average of 11.3% is notably higher than most of the metros sampled in this survey. Given that our sample represents America’s 15 largest metros, this suggests households in smaller, unsurveyed metros are spending a higher portion of their income on home improvements, driving up the national average.
Top- and Bottom-Spending Metros
In general, the top-spending cities tend to do more discretionary improvements such as kitchen remodels and room additions, while the bottom-spending cities focus more on essential work like plumbing and electrics.
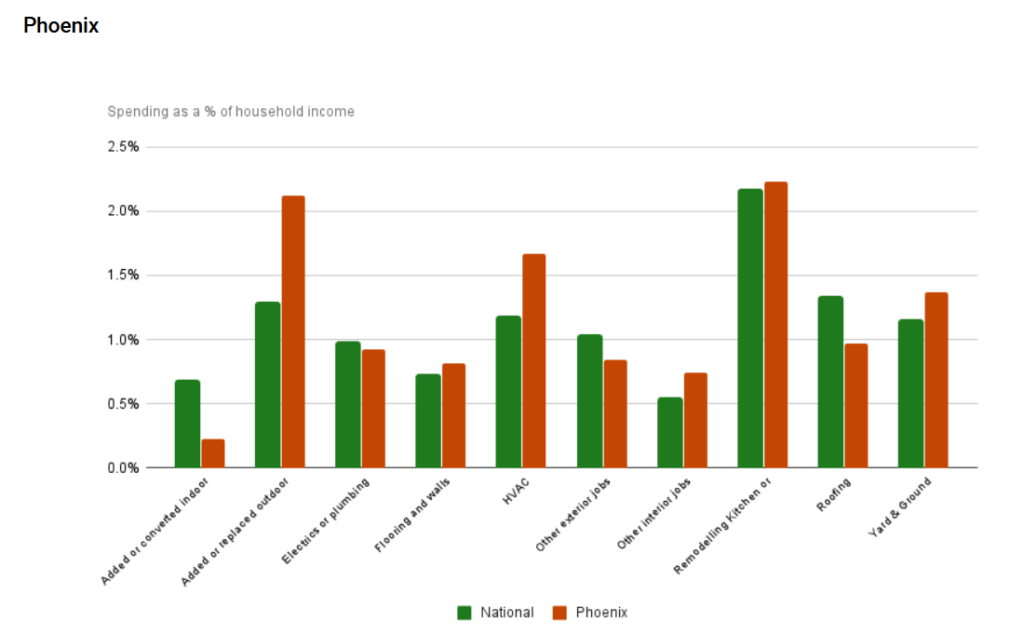
Phoenix’s extreme heat shapes how residents invest in their homes, with significantly higher spending on HVAC systems; households invest $1,700 a year on average, compared to the national figure of $950. Swimming pools are another priority: Phoenix accounts for 3.5% of all pool installations in the nation, despite having only 1.5% of U.S. households.
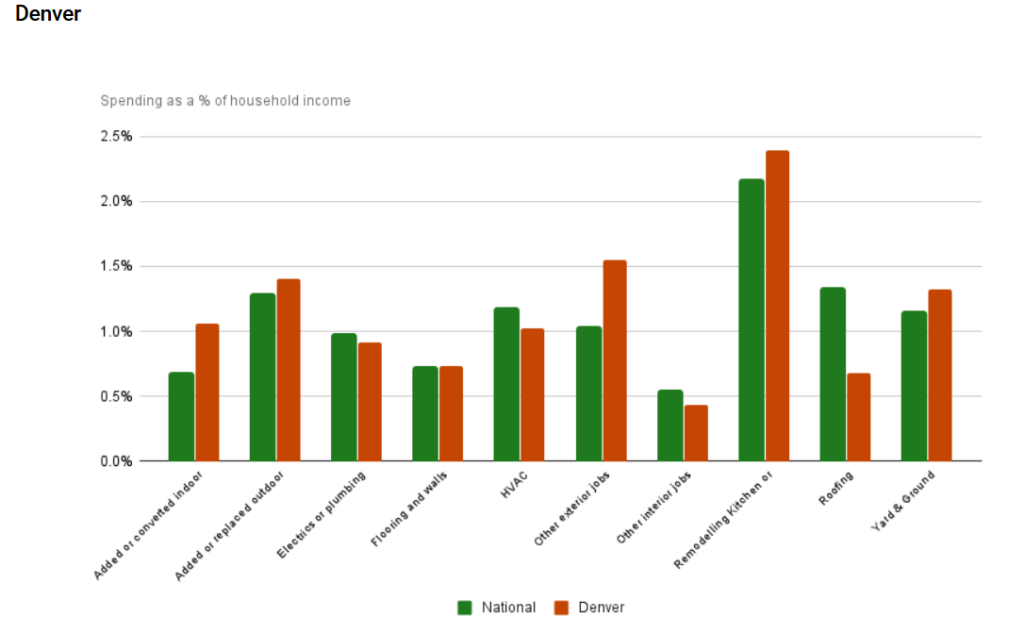
Denver’s renovation patterns show smaller increases across multiple areas. Their number one spend is in the porches, patios, and decking category. Denver households invest 1% of their income there, double the national average. Window and door replacements also see higher spending, along with room conversions.
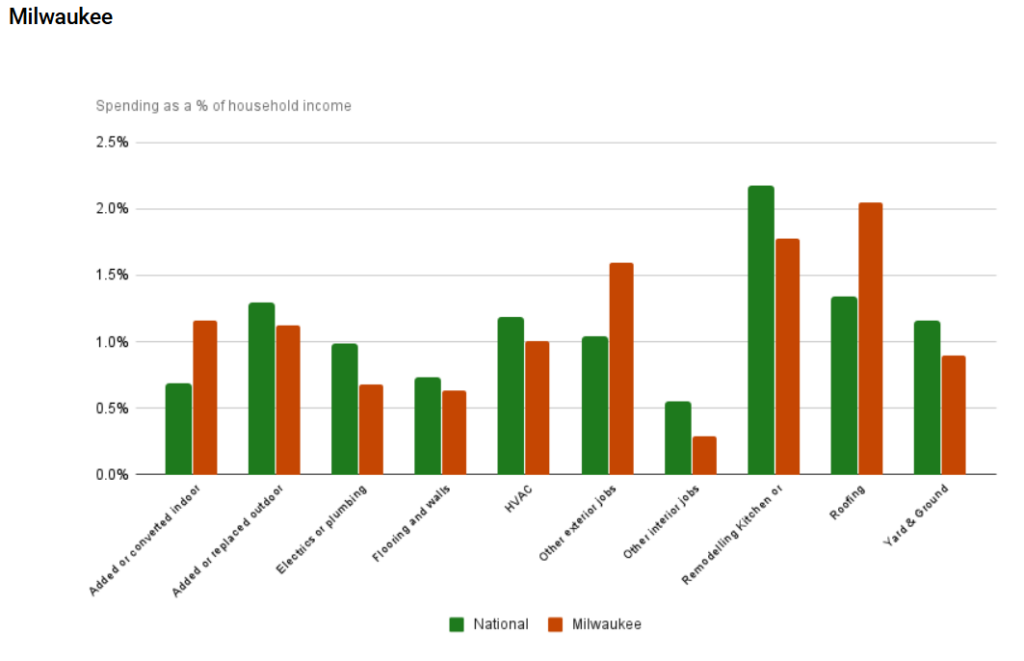
Milwaukee’s harsh winters and freeze-thaw cycles drive distinctive spending patterns. Roofing commands 2% of household income versus the national average of 1.3%, and spending on siding, windows, and doors also exceeds national norms.

Detroit shows lower spending across the board, under-indexing in every renovation category.
Detroit households focus on necessary repairs rather than elective improvements, and they spend drastically less than average on outdoor projects (just $757 annually, roughly half the national average of $1,423). And over 41% of home renovation projects in Detroit are carried out DIY, the highest of any metro in this study.
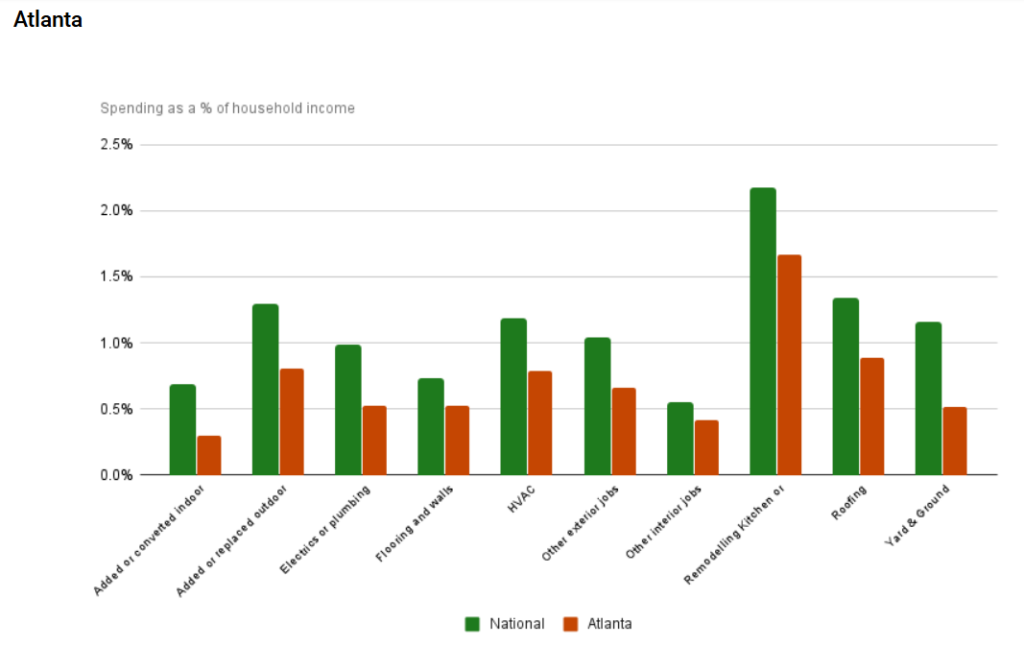
Atlanta also shows consistently lower spending across all home improvement categories compared to national averages, with the biggest spending gaps in yard improvements (just 0.5% of their income, compared to the national average of 1.2%).
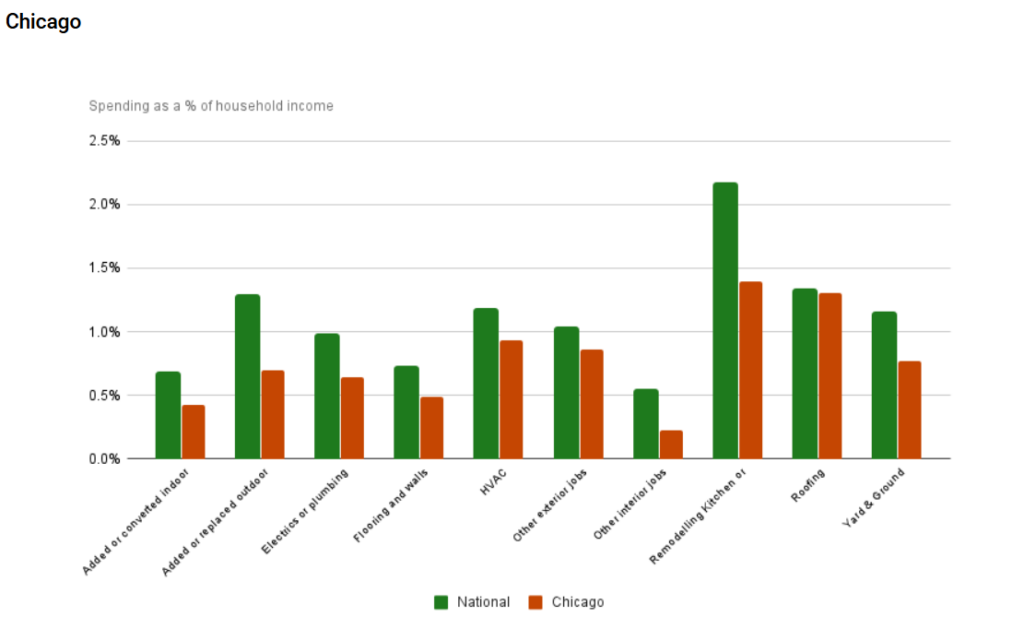
Like Denver and Atlanta, Chicago follows a pattern of lower-than-average spending across most home improvements, with one exception: roofing, which matches the national rate of 1.3% of household income.
Click here for more on Instant Roofer’s study.


