Cotality has issued its Q1 2025 Homeowner Equity Report (HER), showing the geographical and equity growth differences across the U.S., alongside other revolving trends. According to the research, home equity for U.S. homeowners with mortgages—who own about 62% of all properties—rose by $115 billion since Q1 of 2024, or a 0.7% annual growth. This increased net borrower equity to over $17.3 trillion in Q1 of 2025.
Since Q2 2024, negative equity has been increasing every three months. The number of residential properties with negative equity rose by 172,000, or 17%, just from Q1 of 2024.
“Strong home price appreciation since the pandemic has ensured that U.S. homeowners with a mortgage saw a significant rise in their home equity, with annual gains averaging over $38,000 between 2020 and the end of 2022,” said Dr. Selma Hepp, Cotality Chief Economist. “At the peak of home price gains, annual equity increases surged to as much as $55,000. However, with price increases slowing considerably and appreciation remaining sluggish, home equity is unlikely to accumulate at the same pace as it did during the pandemic, or even pre-pandemic, when annual gains averaged about $11,000. In addition, recent declines also reflect that some homeowners are tapping into their equity to finance other activities.”
Map of Average Year-Over-Year (YoY) Equity Gain Per Borrower
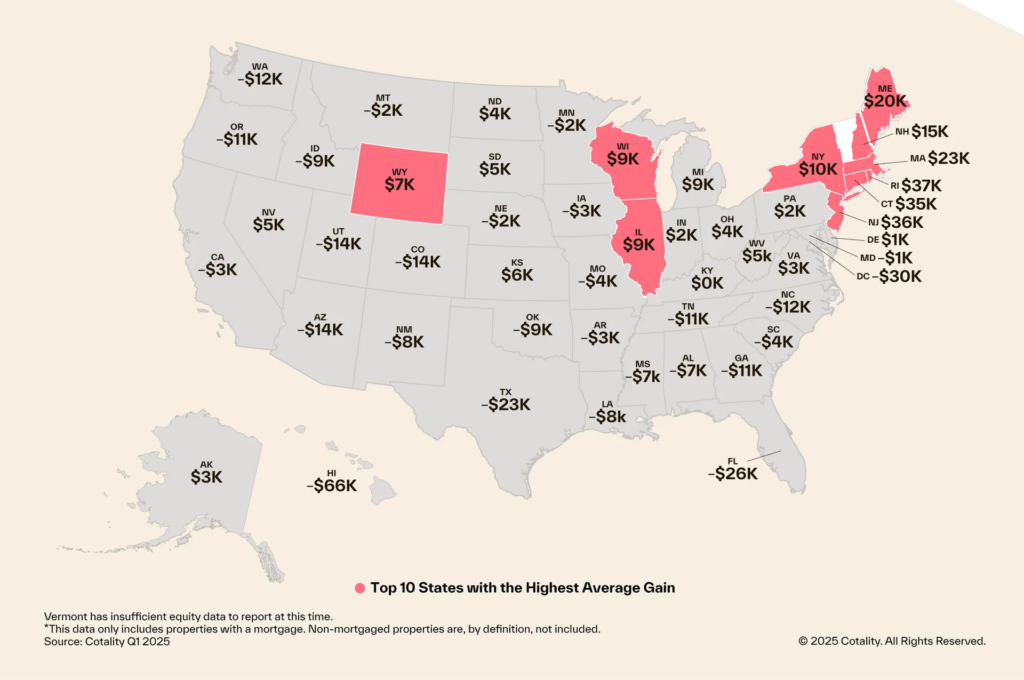
The Top 10 States with the Highest Average Equity Gains
- Rhode Island
- New Jersey
- Connecticut
- Washington, D.C.
- Massachusetts
- Maine
- New York
- Illinois
- Wisconsin
- Wyoming
Even though the proportion of homeowners who have a mortgage with negative equity has been gradually rising, it is still far lower than the rate before to the pandemic and only marginally higher than the Q2 2024 low.
U.S. Borrowers Tap Into Equity Gains
Many other homeowners, especially in the Northeast, are profiting from the ongoing increase in property values and the ensuing increase in equity, even though 1.2 million residential homeowners, or 2.1% of homeowners with a mortgage, are in negative equity. The average equity gains in Boston, Massachusetts, and New York, New York, were $25,200 and $20,600 year, respectively.
However, between Q1 2024 and Q1 2025, homeowners nationwide lost an average of $4,200 in equity. Compared to the $4,300 they made in Q4 of 2023–2024 or the roughly $30,000 yearly growth they experienced in 2023–Q1 of 2024, that represents a sizable loss.
“Geographical differences are important here as the national average is being pulled down by weakening markets in the South—particularly in Texas and Florida—that are masking strong equity growth in the Northeast,” Hepp said. “However, given the weakening of prices in the South and affordability concerns for existing homeowners due to rising insurance and taxes, as well as the prevalence of natural disasters in those areas which can wipe out home equity, there are many areas in the South where we are likely to see increases in negative equity going forward.”

The largest increases in home equity occurred in Northeastern states. Rhode Island and New Jersey saw the highest YoY equity gains, gaining $36,500 and $35,700, respectively, and both states saw new highs in Q1. Of the 27 states that reported yearly equity losses, the top three were:
- Hawaii (-$65.9K)
- Washington D.C. (-$29.6K)
- Florida (-$26.3K)
Negative Equity Share for Select Metro Areas — National
| MSA Name | Negative Equity Share — Q1 2025 | YoY Average Equity Gain — Q1 2025 |
| Boston | 1.1% | $25,200 |
| Chicago-Naperville-Schaumburg, IL | 2.5% | $11,900 |
| Denver-Aurora-Centennial, CO | 1.4% | -$13,500 |
| Houston-Pasadena-The Woodlands, Texas | 1.7% | -$20,900 |
| Las Vegas-Henderson-North Las Vegas, NV | 0.6% | $11,100 |
| Los Angeles-Long Beach-Glendale, CA | 0.8% | $200 |
| Miami-Miami Beach-Kendall, FL | 1.2% | -$4,000 |
| New York-Jersey City-White Plains, NY-NJ | 2.4% | $20,600 |
| San Fransisco-San Mateo-Redwood City, CA | 1% | -$100 |
| Washington, DC-MD | 2.3% | -$11,900 |
Note: This data only includes properties with a mortgage. Non-mortgaged properties are, by definition, not included.

By the conclusion of Q1 of 2025, negative equity had a total value of about $350 billion nationwide. It is up about $10.7 billion, or 3%, from $340 billion in Q4 of 2024, and up about $26.6 billion, or 8%, from $324 billion in Q1 of 2024, YoY.
Although the percentage of homeowners with a mortgage in negative equity has steadily increased to 2.1%, it is still far lower than the 3.6% pre-pandemic rate and only slightly higher than the 1.7% low in Q2 2024. According to the Cotality equity data analysis, which started in Q3 of 2009, negative equity reached its highest point in Q4 of 2009, at 26% of mortgaged residential properties.
To read the full report, click here.


