

A recent national analysis of America’s housing shortage at the neighborhood level discovered a shortfall of nearly two million homes nationwide. The study, Bringing the Housing Shortage Into Sharper Focus by PolicyMap, Moody’s Analytics, and the Urban Institute, used census tract data from nearly 350 U.S. cities with populations over 100,000 to analyze the supply and demand for housing at the local level. The good news is, the study was able to reveal important information about how that shortage varies across neighborhoods.
“It’s so important to be able to understand this data with this level of granularity,” said Maggie McCullough, CEO and Founder of PolicyMap. “We can now see not just how many homes are missing, but where they’re needed, whether they should be rental or owner-occupied, and which income groups are most affected. By partnering with Moody’s Analytics, we combined their estimation model with our granular spatial data to give policymakers a more actionable roadmap.”
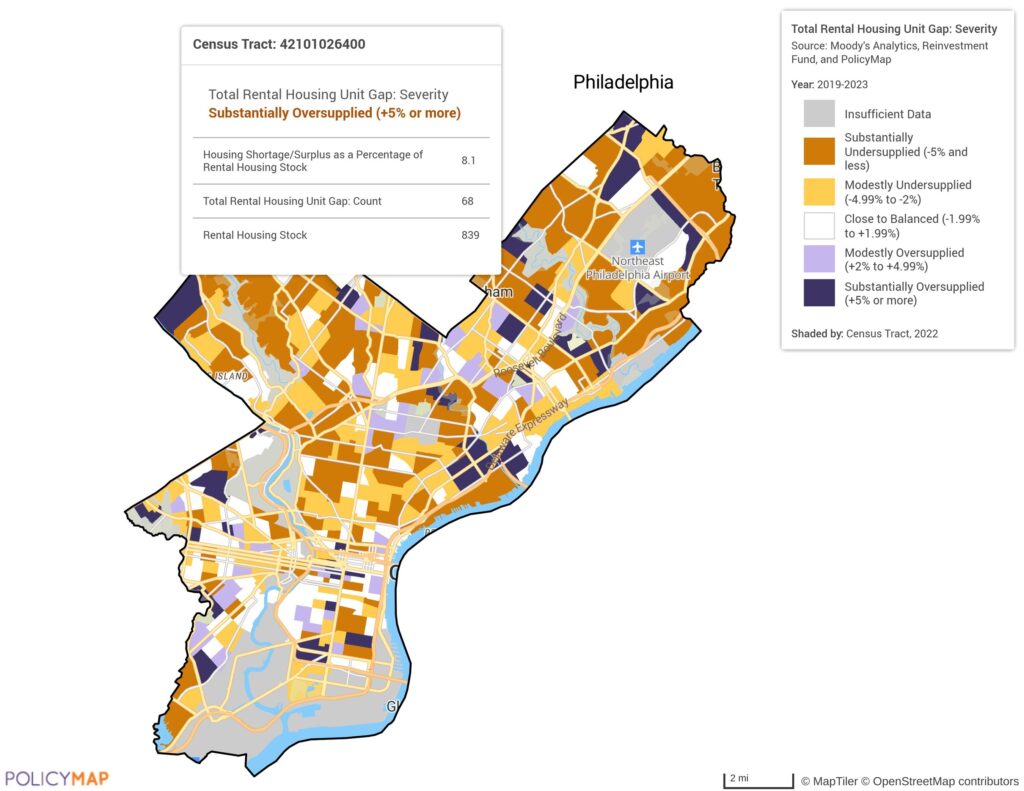
A Granular Look at Housing Supply
The devil is in the details. Earlier efforts offered broad national estimates ranging from 1.5 to more than seven million homes, but this new study drills down much further. It compares local vacancy rates to an “equilibrium” baseline from 2012 to 2018, a period chosen for its relative market stability after the recession and before the disruptions of the COVID-19 pandemic. The study analyzes how current vacancy rates differ from that baseline, and estimates where each neighborhood is under- or over-supplied in both rental and owner-occupied housing.
Key Takeaways
- The deepest shortfalls: Moderate to middle-income rental markets are hit the hardest, showing a widespread gap in what the report terms “workforce rental” housing
- An imbalance in supply: High-income neighborhoods, especially in large cities, often have a surplus of rental units, which creates an imbalance in available supply vs. actual need
- The ownership market: While more balanced overall, some high-income areas are still tight, and some lower-income neighborhoods show small surpluses
- The national shortage of homes: This is driven more by a lack of rental housing than homes for sale
- Revealing imbalances: Many cities appear balanced at the metro level, but contain neighborhood-level imbalances often hidden in aggregated data
“This analysis shows that housing supply is not a one-size-fits-all issue,” said Cristian deRitis, Deputy Chief Economist at Moody’s Analytics. “You can’t solve affordability by adding units in the wrong places. Looking at the census tract level reveals how local mismatches between supply and demand are distorting the broader housing market. Partnering with PolicyMap and Reinvestment Fund allowed us to build a repeatable, data-informed framework that policymakers can use to target solutions more effectively.”
More Than a One-Time Snapshot
One of the strengths of this report is that the American Community Survey (ACS), which it is based on, refreshes annually. This gives cities and researchers the ability to monitor how local housing gaps evolve.
“This wasn’t designed to be a report that sits on a shelf,” added McCullough. “Because the analysis is built on ACS data, we can refresh it each year. And since the census tract-level maps are available on PolicyMap, communities can immediately view their local conditions and use that insight to take action.”
By surfacing detailed neighborhood-level imbalances, the study makes clear why broad national policies often miss the mark.
“The utility of this analysis is that traditional shortage estimates aggregated across a city, state, or region mask sub-markets of housing shortage and oversupply. But families are not indifferent to price, tenure, and neighborhood, and these data help policymakers and investors better understand and meet the needs,” said Ira Goldstein, Senior Advisor of Policy Solutions at Reinvestment Fund.


