According to Zillow’s most recent market analysis, during the past year, home values have decreased in half of the country’s major areas. With more markets moving toward equilibrium and sellers lowering their prices at record-breaking rates to compete, homebuyers are becoming more powerful nationwide. However, buyers are losing the war on affordability even though they are winning the war on negotiating power.
In an estimated 25 large U.S. markets, primarily in the Midwest and Northeast, home values increased over the previous year. Although there is a lot of demand, particularly in more inexpensive locations, new and higher-density developments have been hampered by building limitations. In many metros, the current inventory is still below pre-pandemic averages, and sellers have few options to move up to.
In some 25 cities, most of which are in the South or West, home values have decreased annually, regaining some of the affordability that was lost during the early epidemic price spike. Builders in the South have been better able to meet demand, which has reduced price pressure and given homeowners more options for where to live. In pricey western coastal metropolises like San Francisco and San Diego, buyers are probably still encountering affordability barriers.
Key Highlights — Nationwide Trends
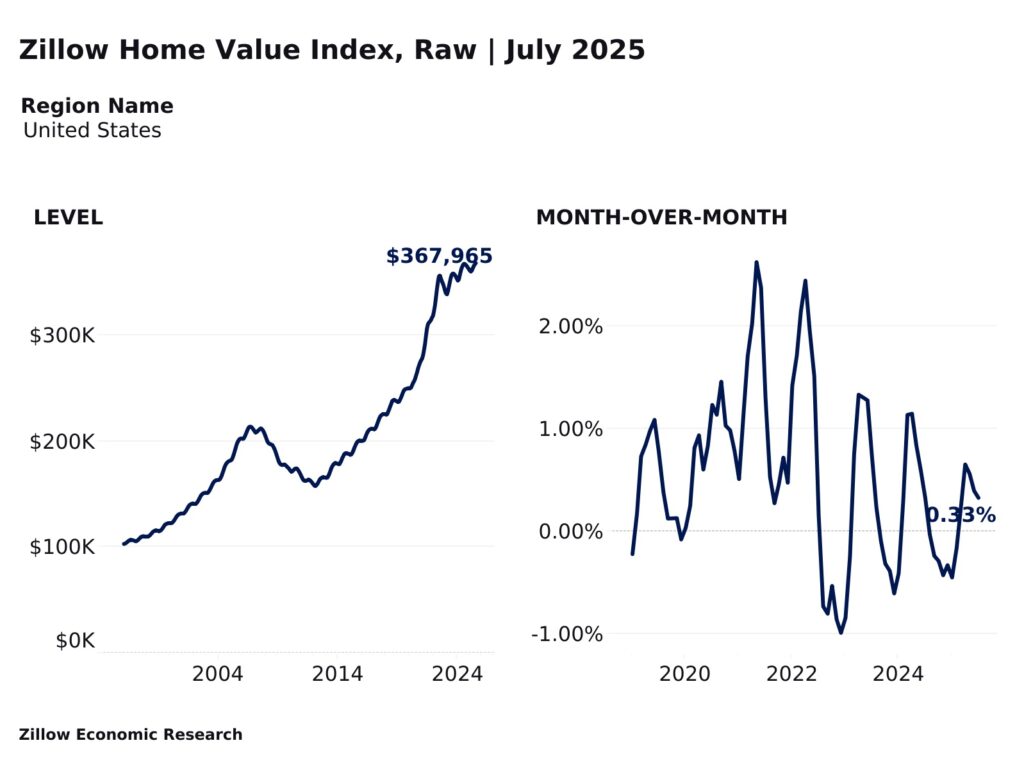
- The average home in the U.S. is worth $367,965.
- Assuming a 20% down payment, the average monthly mortgage payment is $1,907.
- In July, some 28 out of the 50 largest metro regions saw monthly increases in home values.
- In 19 major metropolitan areas, home values decreased on a monthly basis.
- In 25 of the 50 major metro regions, home values have increased compared to the previous year.
- The average monthly mortgage payment has risen by 109% since the pre-pandemic, or about $995, and is down 1% ($19) from the previous year.

Is Now a Good Time for Buyers to Purchase a Home?
“Perhaps more than ever, whether it’s a good time to buy depends on where you live,” said Kara Ng, Senior Economist at Zillow. “A defining trait of this market is that buyers are gaining leverage that most of them can’t use, because cost barriers are too high. Buyers forced to the sidelines means less competition for those who can still afford it. Affordability is gradually improving where builders have been able to keep up with demand, showing why continuing to build is so critical. It’s not just about giving buyers power, it’s enabling them to use it.”
As for the national average, home value appreciation has increased by just 0.2% in the last 12 months, making it almost flat. Affordability has somewhat improved due to lower interest rates and slower price increases; monthly mortgage payments have decreased by $19 in the last 12 months. However, that monthly mortgage payment is still about $1,000 higher than it was before the pandemic.
Among the 50 largest U.S. metros, home values rose the most in the past year in:
- Cleveland (4.7%)
- Hartford, CT (4.5%)
- Louisville, KY (3.9%)
- Detroit (3.8%)
- Buffalo, NY (3.7%)

Even these advances, though, pale in comparison to the double-digit growth that was prevalent three or four years ago. The two largest metro areas where home values are declining the fastest are Florida and Texas, both of which were formerly hotspots for housing demand and price explosions.
Annual declines in typical home values are largest in:
- Tampa, FL (-6.2%)
- Austin, Texas (-6%)
- Miami (-4.6%)
- Orlando, FL (-4.3%)
- Dallas (-3.9%)
Metro areas with the biggest increases in inventories over pre-pandemic levels are also those with the highest price corrections. With the exception of Miami, all of these metro areas are in the top 10 for home building permits between 2020 and 2024. In regions with less land-use restrictions, builders were able to react more quickly when demand for homes increased.
As a result, there were more options for purchasers and more houses for sellers to move into, which reduced the supply. There is still a 4.7 million unit housing deficit in the country, while new building is curbing its rise. At lower price points, there is an underlying need for homes.
Home Price Cuts Vary Across U.S.
In July, sellers lowered the price of 27.4% of listings, the most percentage since Zillow began monitoring this statistic in 2018. Price cuts are less prevalent in markets that are more advantageous to sellers in the Northeast and on the West Coast, and more prevalent in the South and the Mountain region.
Compared to the previous year, there are 1.1 ppts more listings with a price reduction. In June, about 30.9% of properties sold for more than their asking price. This is in contrast to 31.2% the previous month and 35.3% the year before.
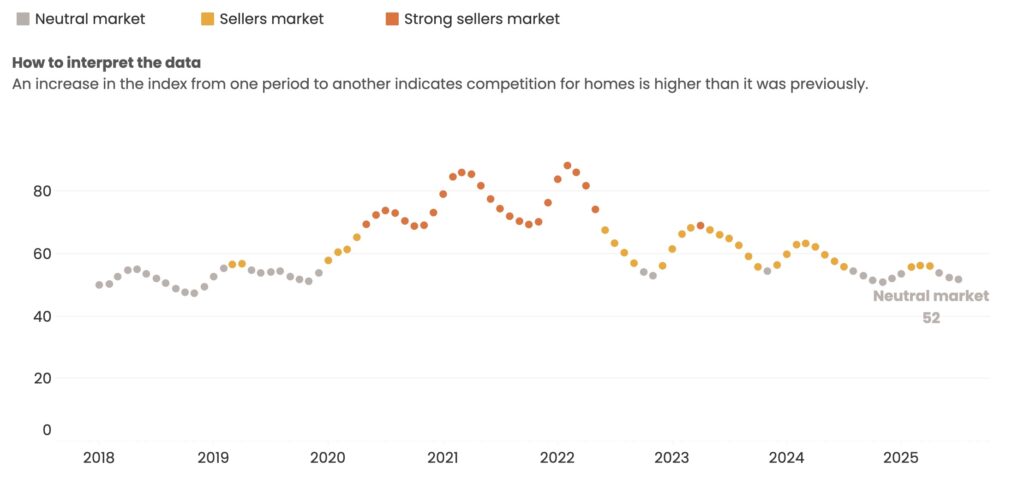
According to Zillow’s market heat index, buyer competition is still declining nationally, hitting its lowest July level since at least 2018. Three more than last month and nine more than last July, there are currently 27 major markets that are either balanced or in the buyer’s favor.
Compared to previous summers, homes are taking longer to sell, and the difference between appealing listings that sell and those that remain is widening. In July, listings sold in 24 days, which was one day longer than the pre-pandemic average for the month but six days slower than the previous year. Nonetheless, Zillow’s median longevity for all listings is 60 days, which is four days longer than the average before the pandemic. According to Zillow statistics, the difference between the two numbers is the most for any July.
For home sellers to be successful in this ever-evolving market, their listing must be appealing to buyers. Today’s consumers start their shopping online. According to Zillow, before choosing to view the house in person, they may get a greater sense of it thanks to features like 3D tours and interactive floor plans.
Additional Findings — National
- In July, there were 1% fewer newly pending postings than the previous month.
- Compared to the previous year, the number of newly pending listings rose by 2.4%.
- For residences that went under contract within a month, the median days to pending, or the average amount of time following the first list date, is 24 days in July—which is four days longer than it was the previous month.
- Compared to last year, the median days to pending increased by six days.
- The country is currently a neutral market, according to Zillow’s market heat index, with less buyer competition than any July in the company’s history, which goes back to 2018.
To read more, click here.


