According to the Q2 2025 U.S. Home Flipping Report published by ATTOM, an estimated 78,621 single-family homes and condominiums were flipped in Q2, making up 7.4% of all home transactions from April to June.
This was a minor decrease from the 7.5% of sales recorded in Q2 of 2024 and a decrease fromQ1 of the year, when flipped properties made up 8.3% of all sales. The decline from quarter-to-quarter is consistent with a seasonal pattern: flipped properties often account for a larger portion of total sales in Q1 of the year, when overall sales are lower.
“We’re seeing very low profit margins from home flipping because of the historically high cost of homes,” said Rob Barber, CEO at ATTOM. “The initial buy-in for properties that are ideal for flipping, often lower priced homes that may need some work, keeps going up.”
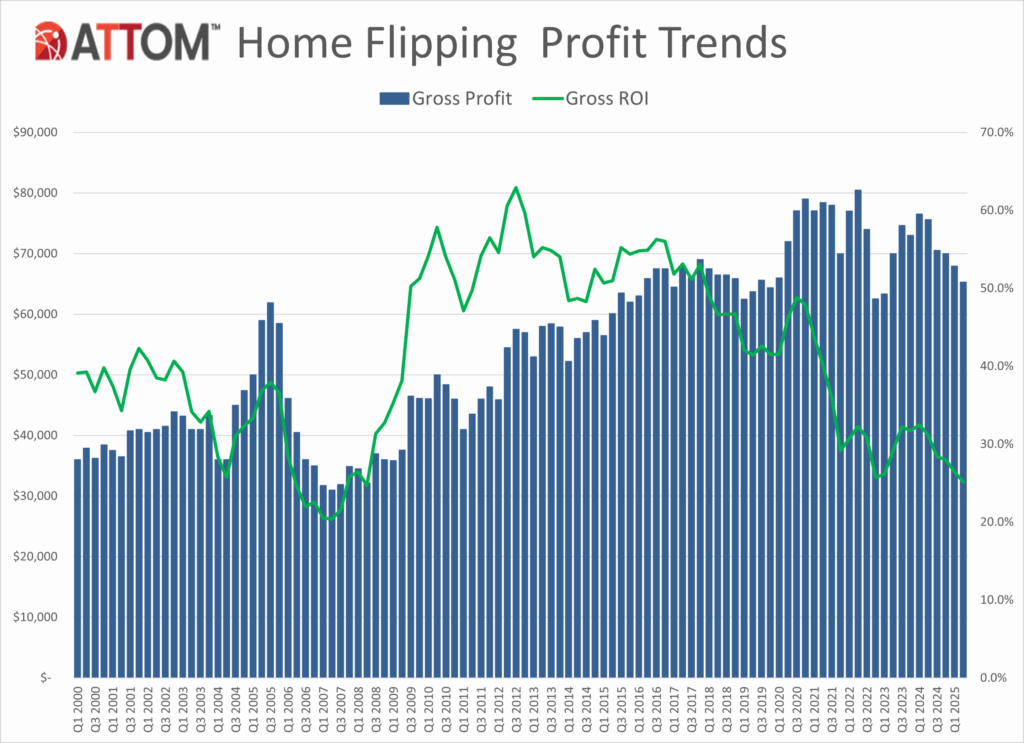
For nearly a decade, home flippers have seen a steady decline in profits. The average flipped property generated a 62.9% return on investment (before expenses) in the fall of 2012. The usual return in the second quarter of 2025 was 25.1%, which was the lowest ATTOM profit margin for home flipping in a quarter since Q2 of 2008.
Additionally, there was a decline in gross profits, which are the difference between a flipper’s purchase price and sale price. In Q2, the average flipped home made $65,300, which was roughly 4% less than the previous quarter and 13.6% less than the same period last year.
The second quarter had the highest median purchase price—the amount an investor paid for a home—since ATTOM started keeping track of the data in 2000, at $259,700. Similar to the previous quarter, the median sales price of flipped homes—the amount that investors sold them for—was $325,000.
“As prospective homeowners get priced out of the middle and high end of the market, they’re more likely to be competing with flippers over the same homes,” Barber said.

Hot Housing Markets for Home Flipping
In 86.3% (158) of the 183 metropolitan statistical areas with enough data to be analyzed in ATTOM’s research, the rate of home flips as a percentage of total property transactions decreased from Q1. In 183 metro areas, the flip rate decreased by 55.7% (102) from Q2 of 2024.
The metro areas where home flips accounted for the largest shares of sales in Q2 of 2025 were:
- Warner Robins, GA (18.5% of total sales)
- Macon, GA (15.5%)
- Atlanta, GA (13.6%)
- Columbus, GA (13%)
- Memphis, TN (12.5%)
Birmingham, AL (11.8%), Cleveland, Ohio (11.2%), and Columbus, Ohio (10.5%) were the metro areas with the greatest flipping rates among those with a population of one million or more, outside of Atlanta and Memphis.
Of those largest metro areas, the ones with the smallest flipping rates were:
- Seattle, WA (4.1% of all home sales)
- New Orleans (4.5%)
- Boston (4.8%)
- Portland, OR (5%)
- Honolulu, Hawaii (5%)

The average home that was flipped in Q2 of 2025 was bought by an investor for $259,700 and sold for $325,000, yielding a $65,300 gross profit and a 25.1% return on investment before expenditures.
In 58% (107) of the 183 metro regions in ATTOM’s survey, profit margins decreased from quarter-to-quarter, and in 70% (128) of the markets, they decreased year-over-year.
The metro areas with the biggest quarterly drops in flipping profit margins were:
- Fort Smith, AR (down from a typical return of 76.3% in Q1to 13.1% in Q2)
- Green Bay, WI (down from 70.1% to 19.3%)
- Clarksville, TN (down from 65.5% to 26.2%)
- South Bend, IN (down from 85% to 52.1%)
- Hilton Head Island, SC (down from 27% profit to a 2.9% loss on flipped homes)
Some 62.6% of flipped properties nationwide were bought entirely with cash in Q2 of 2025. This percentage was slightly higher than the 62.3% recorded in Q1 of 2025, but it was the same as Q2 of 2024.
The metro areas with the highest percentage of flipped homes purchased with cash were:
- Tuscaloosa, AL (85.3%)
- Youngstown, Ohio (82%)
- Flint, MI (80.3%)
- Toledo, Ohio (79.7%)
- Buffalo, NY (79.4%)

Overall, in Q2 of 2025, the average flipped home nationwide took 165 days from acquisition to resale, which was a decrease from 167 days the previous year but an increase from 163 days the previous quarter.
First-time homebuyers frequently employ Federal Housing Administration-backed mortgages, which accounted for 11.2% of flipped homes sold nationwide. Compared to 10.9% in Q2 of 2024 and 11% in the preceding quarter, that represented a modest increase.
In Q2 of 2025, there was still a lot of home flipping in the U.S., but earnings were declining. The average gross return on investment dropped to 25.1%, the lowest level since 2008. The median investor purchase price increased to a record $259,700, pinching profits despite a minor fall in overall flipping volume from the previous quarter due to stubbornly high acquisition prices.
The most common financing option was still cash transactions, and time-to-flip was steadily increasing. Competition from flippers and first-time buyers increased, particularly at the lower end of the market, due to limited availability and rising housing prices.
To read more, click here.


