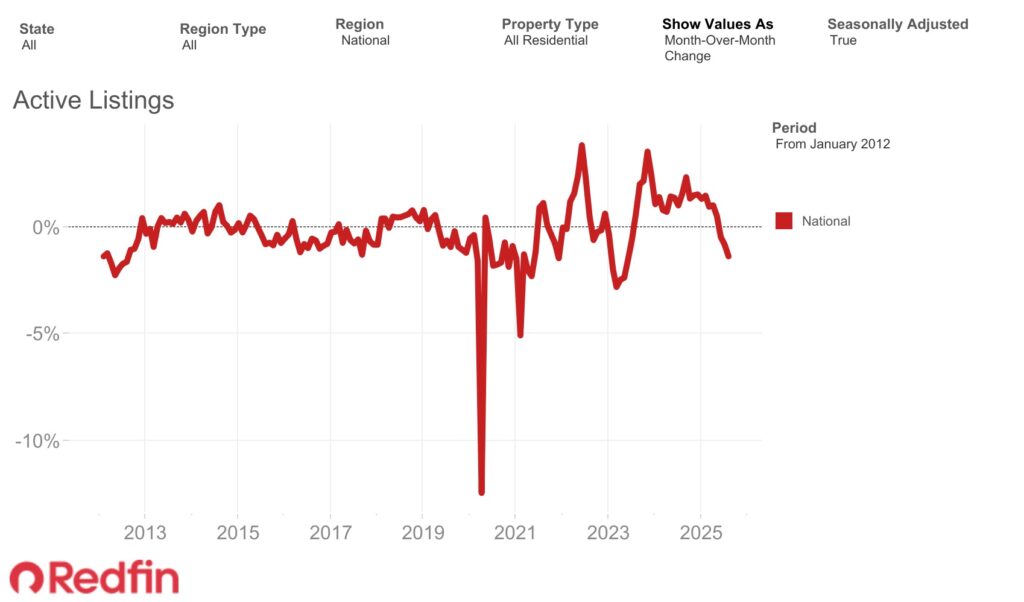
A recent analysis from Redfin revealed that active listings of properties for sale decreased 1.4% month-over-month (MoM) in August, the biggest seasonally-adjusted drop since June 2023. They experienced the lowest year-over-year (YoY) growth since March 2024, up an estimated 9.7% from the previous year.
Additionally, new listings dropped, dropping 2.6% YoY and 1.1% MoM to the lowest seasonally-adjusted level since January 2024.
Due to weak homebuyer demand—sales are still significantly below pre-pandemic levels—sellers have been retreating. Both existing and pending house sales saw no change in August, with existing home sales up 0.2% to a seasonally adjusted annual pace of 4,227,589 and pending sales declining 0.4% on a seasonally adjusted basis from a month earlier.
“High housing costs and economic jitters have rattled buyers, and that unease has spilled over to sellers. We currently expect existing-home sales to end the year at around 4.05 million, or roughly flat compared to 2024, which was the worst year for sales since 1995,” said Chen Zhao, Redfin’s Head of Economics Research. “The good news is mortgage rates have been falling, giving homebuyers more purchasing power. We have yet to see that translate into a significant bump in sales, but that may change if rates continue declining; if we get a stronger-than-expected fall housing market, existing-home sales could end this year a little higher than last year.”
August 2025 Housing Market Highlights — National
| Metrics | August 2025 | MoM change | YoY change |
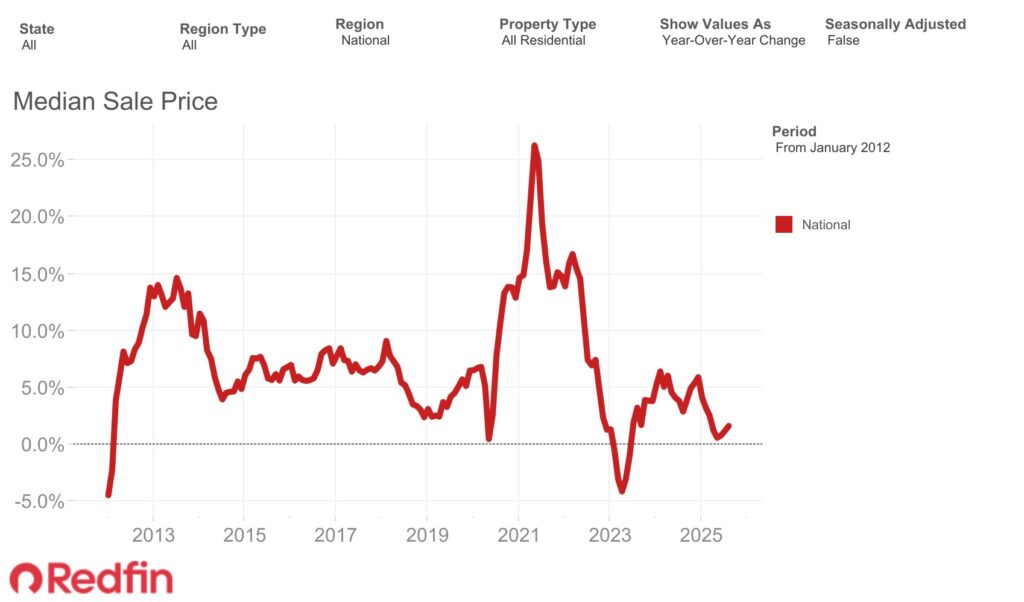
| Median sale price | $440,004 | -0.7% | 1.7% |
| Existing-home sales, seasonally adjusted annual rate | 4,227,589 | 0.2% | 1.7% |
| Pending home sales, seasonally adjusted | 481,843 | -0.4% | 2.2% |
| Homes sold, seasonally adjusted | 435,676 | 1.3% | 2.7% |
| New listings, seasonally adjusted | 523,992 | -1.1% | -2.6% |
| Total homes for sale, seasonally adjusted (active listings) | 1,942,629 | -1.4% | 9.7% |
| Months of supply | 3.3 | -0.1 | 0.4 |
| Median days on market | 47 | 4 | 8 |
| Share of homes that sold above final list price | 26.9% | -2.1 ppts | -3.3 ppts |
| Average sale-to-final-list-price ratio | 98.8% | -0.2 ppts | -0.5 ppts |
| Pending sales that fell out of contract, as % of overall pending sales | 15.1% | 0.5 ppts | 0.8 ppts |
| Monthly average 30-year fixed mortgage rate | 6.59% | -0.13 ppts | 0.09 ppts |
In August, the average 30-year fixed mortgage rate dropped to 6.59%, the lowest level in ten months. Since then, rates have continued to decline, reaching their lowest point in almost a year last week at 6.26%. Existing homeowners are now refinancing more frequently as a result, but many potential purchasers are still holding out hope that rates will drop much lower.
Mortgage rates had factored in the Federal Reserve’s decrease to its benchmark interest rate last week. As market players await further economic data, especially the next jobs report on October 3, Redfin experts predict that mortgage rates will stay stable in the near future.
“I think the magic number is 6%,” said Beth Behling, a Redfin Premier real estate agent in Chicago. “Prospective homebuyers are paying attention to mortgage rates, and if they drop to 6%, I think we’ll see a flood of interest.”

Sellers Stall Home Purchases as August Home Prices Increase
August saw the largest increase since March and the highest August level on record, with the median home sale price up 1.7% year over year to $440,000.
Because there are fewer homes available for purchase, property prices may be rising. In August, 44 of the 50 most populated U.S. metro areas had fewer new listings than the previous year. In contrast, just 20 metro areas reported a decrease from the previous year. In the meantime, the number of metro areas seeing price increases increased; in August, median sale prices increased from a year earlier in 42 of the top 50 metro areas, compared to 31 metro areas in July.
In many places, buyers can locate bargains and negotiate concessions from sellers because there are still significantly more sellers than buyers in the market.
Further, despite their recent retreat, sellers still enjoy a an estimated 35.2% advantage over buyers, the second-largest margin ever recorded. August saw the largest August supply of for-sale houses in 10 years, with 3.3 months available.
Because so many homes are sitting on the market, supply is increasing. It was the slowest August since 2016; the average home that went under contract last month did so in 47 days. Additionally, the average house sold for 1.2% less than what it was originally listed for, which is the biggest August markdown since 2019.
According to Redfin agents, sellers in certain areas are beginning to learn how to set competitive prices in order to sell their homes fast.
“It definitely feels like a buyer’s market,” said Nikkolene Byron, a Redfin Premier real estate agent in Palm Springs, CA. “Most homes for sale today only get one offer. I see multiple offers occasionally, but not multiple super strong offers like we saw during the pandemic homebuying frenzy—now they’ll come in lower than the seller wants or the buyer will ask for concessions like money toward closing costs.”

Additional Highlights — U.S.
August 2025 Metro-Level Findings
- Prices: Median sale prices rose most from a year earlier in Detroit (10%), Cleveland (8.7%) and New Brunswick, NJ (7.8%). They fell in seven metros, with the largest declines in Dallas (-3.3%), West Palm Beach, FL (-1.7%) and Phoenix (-1.1%).
- Pending home sales: Pending sales rose most in Pittsburgh (11.4%), Cleveland (8.6%) and Phoenix (6.4%). They fell most in Detroit (-8.6%), Miami (-8%) and Seattle (-8%).
- Closed home sales: Home sales rose most in Indianapolis (8.9%), Houston (6.8%) and Phoenix (4.1%). They fell most in Las Vegas (-15.8%), Fort Lauderdale, FL (-13.4%) and Miami (-13.1%).
- New listings: New listings rose in six metros, with the largest increases in Pittsburgh (3%), Detroit (2.9%) and New Brunswick (2.6%). They fell most in Orlando, FL (19.6%), Fort Lauderdale (-15.4%) and Tampa, FL (-15.3%).
- Active listings: Active listings rose most in Las Vegas (23.7%), Dallas (18.1%) and Anaheim, CA (17.8%). They fell in three metros: San Francisco (-7.4%), San Jose, CA (-2.8%) and Chicago (-1.7%).
- Sold above list price: In Newark, NJ, 62.5% of homes sold above their final list price, the highest share among the metros Redfin analyzed. Next came Nassau County, NY (58.7%) and Milwaukee (48.9%). The lowest shares were in West Palm Beach (5.9%), Fort Lauderdale (7.2%) and Miami (7.8%).
- Days on market: In Miami, the typical home that went under contract did so in 89 days, up 23 days from a year earlier—the biggest increase among the metros Redfin analyzed. Next came Fort Lauderdale (+21 days) and Riverside, CA (+20 days). The smallest increase was in Kansas City, MO (+0 days), followed by Minneapolis, Milwaukee, Philadelphia and Chicago, which all saw an increase of one day.
To read more, click here.


