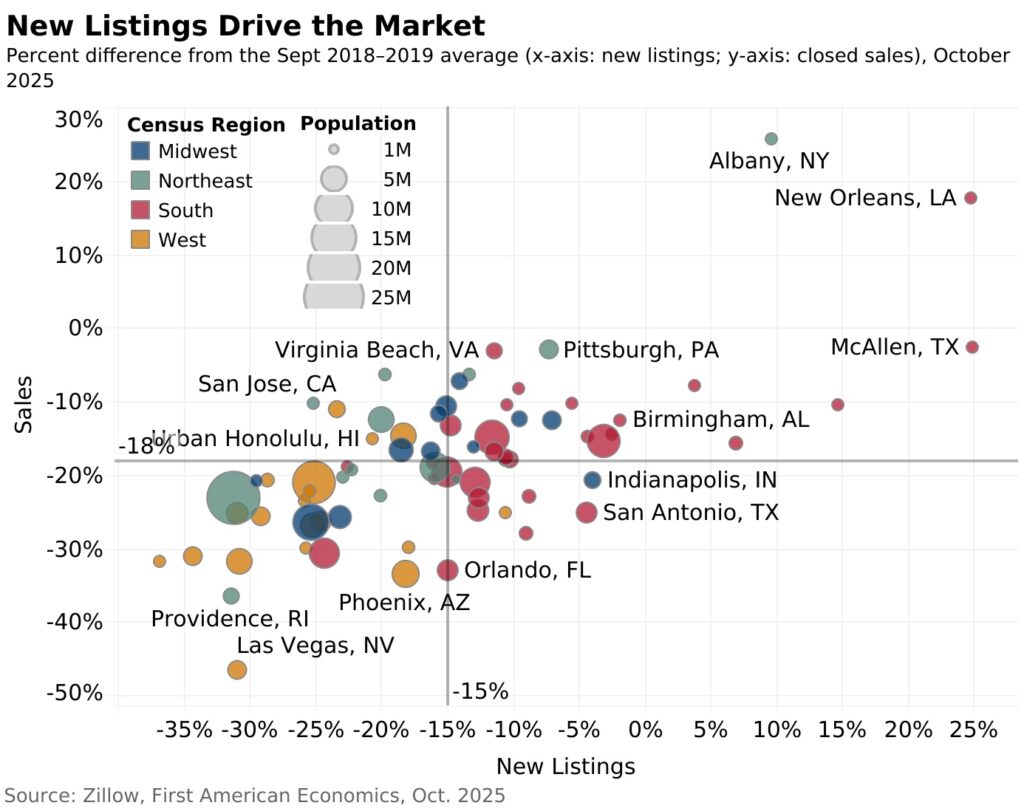
According to new data from First American, home sales are still slow after a protracted period of muted activity, with the rate of sales still hovering around 4 million yearly. The Existing-Home Sales Outlook predicts a little increase in October since demand is still high but transactions have been hampered by a lack of supply and issues with affordability. The slight improvement on the supply side is one cause for cautious optimism. One of the market’s most persistent bottlenecks has been addressed as new listings have grown yearly and approached pre-pandemic levels.
Why revisit pre-pandemic levels? Demand, supply, and mortgage rates were more balanced in the years before to 2020, which provides a fair baseline for what “normal” looked like. The degree to which the housing market has recovered from the pandemic-era distortions—characterized by a super sellers’ market, rate shocks, and skyrocketing prices—followed by the following downturn can be determined by comparing the activity of the market today with that of the 2018–2019 period. There is an obvious positive correlation between the two: sales typically increase as new listings approach normal.
“This dynamic offers some optimism for 2026. As more homeowners list, more buyers will have opportunities to purchase, moving the market one step closer to balance. Where new listings grow, sales flow,” said Odeta Kushi, Deputy Chief Economist at First American.

Examining Sales & Listing Trends Nationwide
First American used a straightforward “how close to normal” assessment for both metrics by comparing October 2025 new listings and sales in 75 major markets to each market’s own October 2018–2019 average. Since flow is important for transactions, we concentrate on fresh listings. If properties take longer to sell, active inventory may rise, but new listings provide buyers additional possibilities. Using the 75-market average for each measure as the midlines, the outcome is a scatterplot with four quadrants. This is what the quadrants display with that framing:
- Pace setters: For both new listings and sales, these markets are nearer their pre-pandemic October levels than the average market. As supply improves and sales react, these markets seem to be spearheading the return to more normalized activity. Pittsburgh, Knoxville, TN, and Virginia Beach, VA, are a few examples. Markets from the South, Northeast, and Midwest are included in this area, and many of them are reasonably priced.
- Demand-ahead: Compared to listings, sales are closer to the market’s pre-pandemic average, and they are also closer than the average market as a whole. This quadrant is dominated by markets in the Northeast and Midwest. Consider cities like Boston or Detroit, where buyer demand appears to be strong in relation to what is being marketed. These metros may become pace setters if supply becomes even more unrestricted.
- Supply-ahead: More more than the average market, new listings have returned to normal. Many of these are Southern markets, such San Antonio or Tampa, Florida. Demand-side frictions, such as price restrictions, rate sensitivity, or regional labor market and economic conditions, are probably reflected in the pattern.
- Stuck in neutral: Compared to the average market, both metrics deviate further from each market’s pre-pandemic norm. This includes Western metropolitan areas like Portland, OR, and Los Angeles, where sales have not yet caught up and new listings are still below average.
New Listings Helping Strengthen Complex Housing Market
Improving inventory appears to be a crucial component of a long-term recovery, as evidenced by the high correlation between the normalization of sales volume and new listings.
For the month of October, First American updated its Existing-Home Sales Outlook Report to show that:
- Existing-home sales for October are expected to increase 0.3% from last month’s pace of sales, and increase 1.1% compared with the pace of sales a year ago.
- The largest contributors to the projected monthly increase in existing-home sales are a resilient economy (+0.3%), a weaker rate lock-in effect as measured by the lagged* spread between the prevailing market mortgage rate and the average rate for all outstanding mortgages (+0.3%), and higher house-buying power (+0.1%).
Note: The spread is incorporated with a two-month lag in the Existing-Home Sales Outlook model.


