



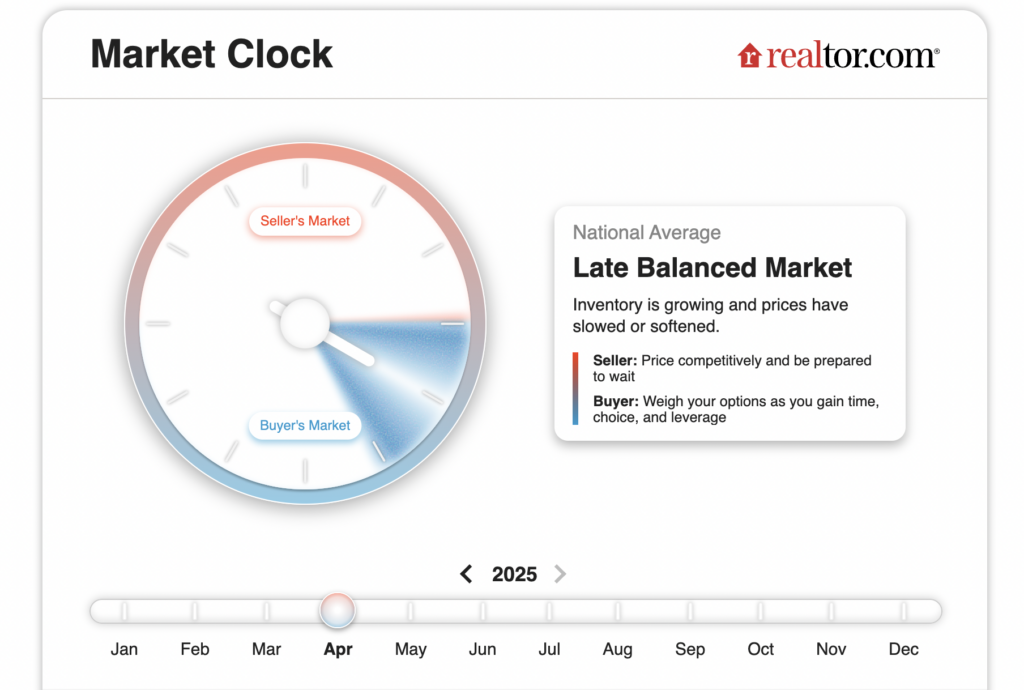
According to a recent survey by Realtor.com, just 26% of the country’s top property markets are still seller’s markets, while just over 60% have shifted into balanced or buyer-friendly territory. The results coincide with the launch of the Realtor.com Market Clock, a new tool intended to break through the clutter of housing data and provide buyers, sellers, and market observers with a better understanding of the current state and potential future directions of local markets.
According to the Realtor.com Market Clock, the national housing market is in a “balanced-loosening” phase at three o’clock, moving toward buyer-friendly circumstances but not necessarily getting there very soon. However, the country’s 50 largest metro areas, which today span almost the whole face of the clock, exhibit dramatic diversity, which is hidden by that national reading.
Some 13 (26%) of the top 50 metro areas are still seller’s markets, 23 (46%) are in balanced-loosening phases, eight (16%) are buyer’s markets, and six (12%) are in balanced-tightening terrain. This indicates that a small but significant portion of markets are actually moving back toward seller advantage.
“A national picture is useful, but when making a real estate decision, the local details are what really matter,” said Danielle Hale, Chief Economist at Realtor.com. “Right now, a homebuyer in Houston or San Antonio is navigating a very different market than someone in Hartford or Milwaukee. The Realtor.com Market Clock was built to make those differences visible at a glance.”
Midwest & Northeast Find Pockets of “Seller Strength,” South & West Remain “Buyer-Friendly”
With all eight buyer’s marketplaces situated in either the West (1) or the South (7), the regional landscape is diverse. and the majority of the 13 seller markets are from the Northeast (3) and Midwest (7).
Five of the eight metro areas that are now designated as buyer’s markets are in Florida or Texas; these include:
- Austin, Texas
- Tampa, FL
- Jacksonville, FL
- Orlando, FL
- Miami
According to the framework, all eight buyer’s market metro areas are presently in “early buyer” circumstances, which means that inventory is increasing, price reductions are frequent, buyers are beginning to gain the upper hand, and their negotiation power is expected to increase in the upcoming months.
Eight more of the top 50 markets are in the Late Balanced phase of the Market Clock at four o’clock. Although these metro areas—Charlotte, NC; Washington, DC; Phoenix; and Las Vegas—remain balanced, properties are sitting longer, prices are declining, and buyers will probably have a clear advantage in the upcoming months.
| Quadrant | Region | Metro | Clock Hour | Hour Description |
| Seller’s Markets13 metros(3 Northeast, 7 Midwest, 1 South, 1 West) | Midwest | Grand Rapids-WY-MI | 11 | Early Seller |
| Midwest | Kansas City, MO-KS | 11 | Early Seller | |
| Midwest | Milwaukee-Waukesha-West Allis, WI | 11 | Early Seller | |
| Midwest | St. Louis, MO-IL | 11 | Early Seller | |
| Northeast | Providence-Warwick, RI-MA | 11 | Early Seller | |
| West | San Francisco-Oakland-Hayward, CA | 11 | Early Seller | |
| Midwest | Chicago-Naperville-Elgin, IL-IN.- WI | 12 | Peak Seller | |
| Midwest | Indianapolis-Carmel-Anderson, IN | 12 | Peak Seller | |
| Northeast | Hartford-West Hartford-East Hartford, CT | 12 | Peak Seller | |
| South | Virginia Beach-Norfolk-Newport News, VA-NC | 12 | Peak Seller | |
| Midwest | Columbus, Ohio | 1 | Late Seller | |
| Northeast | Boston | 1 | Late Seller | |
| West | San Jose, CA | 1 | Late Seller |
To read the full report, click here.