



Growth in rent has slowed, according to a new Zillow analysis. However, that does not equate to relief for millions of American tenants. Renters care more about the monthly payment than the pace of growth, and 2024 was just another year that went in the wrong direction. Cost-burdened renter households increased from 20.9 million in 2023 to 21.4 million in 2024. This indicates that rent accounted for more than 30% of income for 47.6% of renter households nationally. The number of severely burdened households—those who spend more than half of their income on rent—rose from 10.5 million to 10.9 million.
The report also showed. that increasing demand has outpaced the federal rental aid program. In 2024, there were around 2.79 million Housing Choice Vouchers in use, meaning that there were about 18.6 million more cost-burdened renter households than there were available vouchers. This difference increased from 18.2 million the year before. Although not all burdened households are eligible for aid, this estimate shows the trend of the assistance gap. Finding a landlord who will accept a voucher is far from certain, even for those who do qualify.
Rents are not declining just because rent growth is slower. It indicates that rent increases are still occurring, but at a slower rate. For rent burdens, this divergence is important. Families are affected not just by the present growth rate but also by the amount of rent they must pay. When rents stay high in relation to salaries, affordability may still be a problem even if rent increase decreases. Additionally, a significant portion of the story is revealed by the disparities among metro areas. In addition to having higher rents, higher-rent metro areas typically have more renter households.
There are more cost-burdened households in pricey markets, which can be explained by this composition impact. A greater proportion of households are initially subject to rent pressures when a higher percentage of them rent. Therefore, pricier markets would still often exhibit more widespread renter strain simply because renting is more popular there, even if the risk of being burdened by costs were the same everywhere. Both forces are active in real life. Renters make up a greater proportion of all households and frequently pay higher rents in pricey metropolitan areas. The percentage of households facing rent stress varies significantly between metro areas as a result of this combination.
Rent-Burdened Household Gap & Housing Vouchers is Increasing
The number of Housing Choice Vouchers increased little from 2.75 million in 2023 to approximately 2.79 million in 2024. As a result, there were about 18.6 million more cost-burdened renter households than vouchers available, compared to about 18.2 million a year earlier. The primary rental assistance program of the U.S. Department of Housing and Urban Development (HUD) is Housing Choice Vouchers, which are managed locally by about 2,000 public housing agencies.
This disparity should not be interpreted as the number of homes that are eligible for vouchers but have not received them. In addition to additional eligibility requirements that are managed by regional housing agencies, HUD’s program is intended for very low-income and extremely low-income households. Additionally, waiting lists and selection preferences are managed by local organizations, which have an impact on who receives aid. Therefore, the voucher shortfall is an essential metric of size even though it is not a physical waitlist shortage for every burdened tenant. It demonstrates that the number of renter households experiencing financial hardship is significantly more than the amount of aid that is accessible.
Even for homes who do qualify and get a voucher, there is another restriction. Households must have at least 60 days after receiving a voucher to look for a rental property that will take it. That search might be challenging in a competitive rental market, as is the case in many Northeast urban areas. A household must ask the housing agency for an extension if they are unable to locate a unit in time.
This implies that there may be a greater gap between renter need and effective aid than what the voucher count alone indicates. Even after receiving a voucher and being eligible, some households may still find it difficult to rent an apartment.
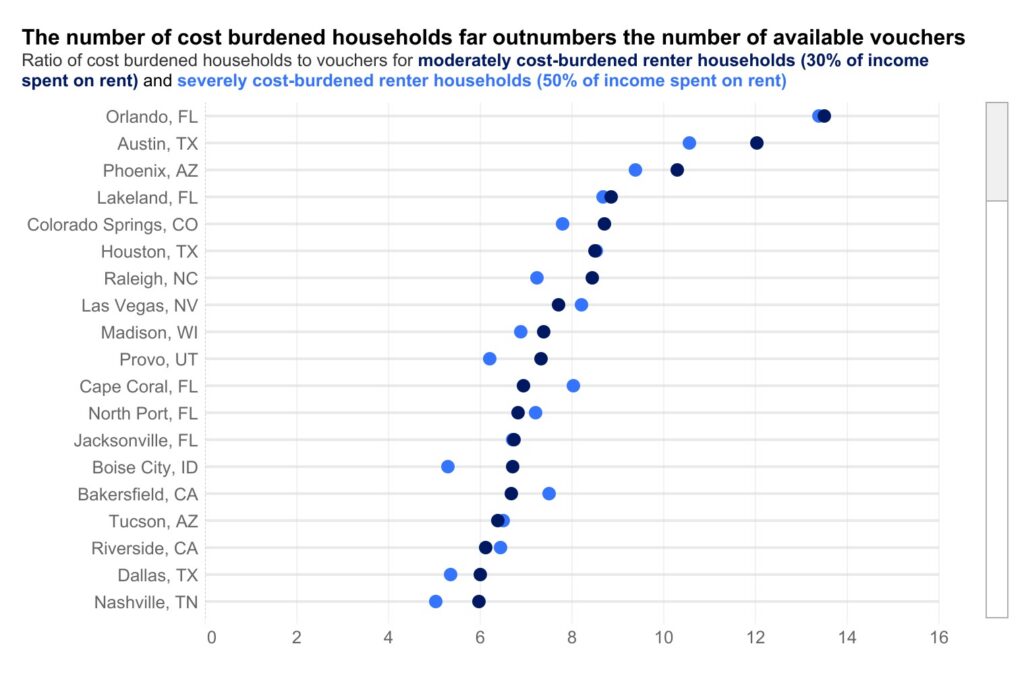
In several of the biggest cities in the nation, this disparity was particularly pronounced. More than ten cost-burdened renter households per available voucher were present in 29 of the 100 largest metro areas in 2024, compared to 24 in 2023. Orlando, FL, Austin, Texas, Phoenix, Lakeland, FL, and Houston continued to be the metro areas with the greatest burden-to-voucher ratios. These locations do not always contain the highest percentages of cost-burdened renter households, nor are they the most costly rental markets in the nation. That is the crucial aspect.

The disparity depends on both eligibility and the financing and management of voucher support. The measured gap between burden and accessible help will inevitably appear higher in a community where a large number of burdened renter households do not match voucher eligibility requirements. However, the distribution of vouchers does not quite correspond with the current metro-level support requirements. They are run by regional organizations, each of which has its own waitlists, funding records, and program size.
Furthermore, success is not assured even if a household is eligible and gets a voucher. While some markets do not have state or local source-of-income (SOI) safeguards that prohibit landlords from turning away tenants due to their use of vouchers, others do. States like Idaho and Missouri have recently approved preemption laws that essentially forbid locals from enforcing SOI laws, even though some U.S. towns and counties have continued to do so.
For instance, the California Civil Rights Department enforces the Fair Employment and Housing Act and publishes guidelines that list a number of unlawful practices, such as charging a higher deposit or rent or denying a tenant access to a pool or common areas because they receive voucher assistance. However, research indicates that about 30% of households countrywide who obtain housing vouchers ultimately fail to locate a residence that will accept the voucher.
To put it another way, the most expensive markets do not usually have the biggest burden-to-voucher disparities. They are frequently found in areas where there is a comparatively small local voucher footprint, where fewer households with high rent match the eligibility requirements, or where it is more difficult for voucher holders to find a landlord who will rent to them.
So, the question remains, what more must be done to support struggling renters? The answers may be best explained from two viewpoints:
- First, in 2024, renter concerns, hardships and housing sentiment were still becoming worse. The damage to affordability caused by years of rapid rent rises was not reversed by slower rent growth, and expenses kept rising.
- Second, there was still a huge disparity between renter needs and rental aid. Furthermore, the disparity is more than just a tale of pricey locations. It also discusses renter eligibility, voucher funding, the challenges of locating a landlord who will accept a voucher, and the unequal distribution of legal protections and voucher assistance in local housing markets.
To read the full report, click here.