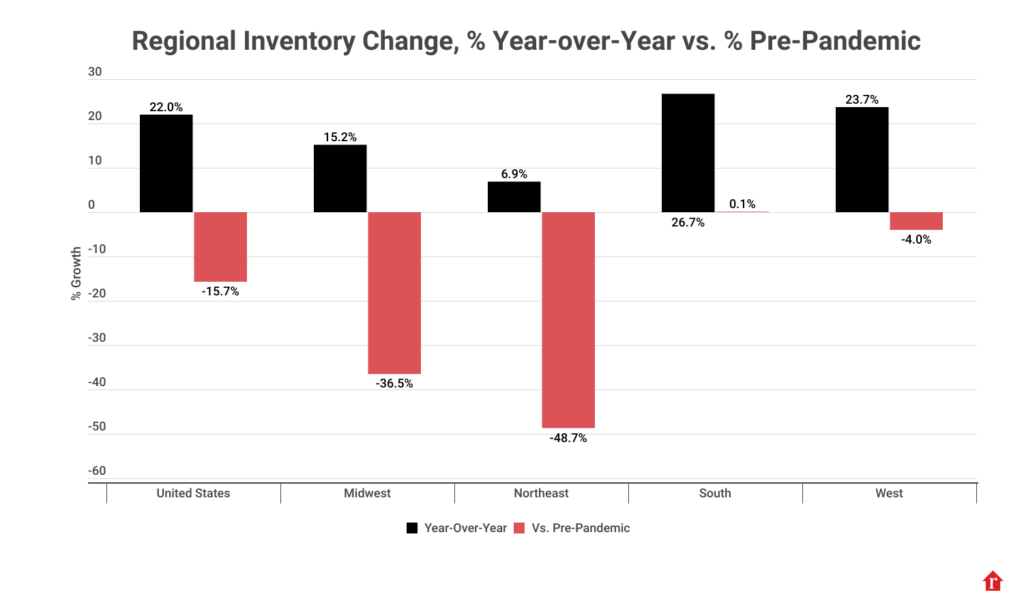
According to Realtor.com‘s December Monthly Housing Trends Report, the number of properties for sale increased by 22.0% in December 2024 when compared to the same period the previous year. Among the top 50 U.S. metro areas, Miami (45.4%), San Diego (42.4%), and Denver (41.9%) had the biggest annual rise in active listings.
- Inventory of homes actively for sale grew for the 14th straight month.
- With 12.9% of sellers lowering their prices in December—up just a little from 12.7% in December 2023—the percentage of listings with price reductions was basically unchanged from the previous year.
- December brought 0.9% more newly listed homes compared to the same time last year.
- Homes spent 70 days on the market, the slowest December in five years.
- Although the median price of homes for sale in December was $402,502—an estimated 1.8% decrease from the previous year—the median price per square foot increased by 1.3%, suggesting that the supply of smaller and more reasonably priced homes is still increasing in proportion.
“December is traditionally a slower time for the market, as people settle in for the holidays, and we expect to see a seasonal downturn each year,” said Danielle Hale, Chief Economist, Realtor.com. “Compounding this, mortgage rates are hovering in the high 6s, following a strikingly different trend than at this time last year. Nevertheless, the number of homes for sale grew compared to last December. Further, growing activity in newly listed homes and a slower market pace could spell opportunity for winter buyers who want to get ahead of the busier spring season.”
December 2024 Housing Metrics – National
| Metric | Change over Dec. 2023 | Change over Dec. 2019 |
| Median listing price | -1.8% (to $402,502) | +34.2 % |
| Active listings | +22.0 % | -15.7 % |
| New listings | +0.9 % | -11.0 % |
| Median days on market | +9 days (to 70 days) | -7 days |
| Share of active listings with price reductions | +0.2 percentage points(to 12.9%) | +2.4 percentage points |
| Median List Price Per Sq.Ft. | +1.3 % | +49.0 % |
December’s year-over-year growth of 22% was little less than November’s 26.2% growth, despite the fact that properties actively for sale increased for the fourteenth consecutive month. Nevertheless, inventories is still slowly returning to levels seen in 2017 and 2019. Due in part to the Christmas vacation, seller activity halted in December, with newly listed houses being 0.9% higher than the previous year, down from a 2% increase in November. Additionally, inventory was 15.7% below pre-pandemic levels in December, a significant drop from the 21.5% deficit the month before.
December 2024 Regional Statistics
| Region | Active Listing Count YoY | New Listing Count YoY | Median Listing Price YoY | Median Listing Price Per SF YoY | Median Days on Market Y-Y (Days) | Price-Reduced Share Y-Y (Percentage Points) |
| Midwest | 15.2% | -6.6% | 0.7% | 3.0% | 4 | -0.4 pp |
| Northeast | 6.9% | -5.6% | 0.4% | 3.9% | 5 | -0.8 pp |
| South | 26.7% | 4.8% | -2.3% | 0.3% | 10 | +0.1 pp |
| West | 23.7% | 2.0% | -1.3% | 1.6% | 8 | +1.5 pp |

December Days on Market Reach a 2024 High, Meaning Homebuyers Have More Time
Compared to the same period last year, homes were on the market for longer this December. The average property was on the market for 70 days, which is seven days longer than it was last December and six days longer than it was in November 2024. Homebuyers should be aware that this December is the slowest month of 2024 overall and the slowest December since 2019 due to days on market.
In December, time on market increased in 46 of the 50 largest metro areas. The cities with the biggest increases in time on market this month were Nashville, TN (+22 days), Orlando, FL (+21 days), and Rochester, NY (+21 days). Despite the increase, time on market is still lower in the South (-4 days), Midwest (-17 days), and Northeast (-19 days) than it was before the pandemic, with the exception of the West, where time on market is more in line with pre-pandemic levels (+1 day).
With a 1.3% increase this December over the same period last year, the price per square foot is still rising. Nonetheless, certain metropolitan regions experienced far larger increases, with double-digit growth in Hartford, CT (12.9%) and Cleveland (13.9%), followed by Milwaukee (8.5%). The growth is higher than it was before the pandemic; the median price per square foot increased by 49.5% nationwide compared to pre-pandemic levels, with 20 of the 50 metro areas seeing growth of this magnitude or more, with Hartford, CT (66.8%), New York (66.8%), and Nashville, TN (60.3%) all seeing growth above 60%.
Price reductions were up 0.1 percentage points in the South and 1.5 percentage points in the West compared to the previous year, but down 0.8 and 0.4 percentage points in the Northeast and Midwest, respectively. The percentage of price reductions in 26 of the 50 largest metro areas increased from 11 in November to 26 in comparison to last December. The largest rise was in Denver (+11.5 percentage points), followed by Providence, RI (+7.8 percentage points), Portland, OR (+8.7 percentage points), and Denver.
To read the full report, including more data, charts, and methodology, click here.


