


Inflation has been exceptionally high in the 2020s, with average prices (as measured by the Consumer Price Index [CPI]) up 22% for the decade as of June 2024. That’s already surpassing inflation for the entire 2010s at 20%, and well on the way to topping the cumulative inflation of the 2000s and 1990s (29% and 32%, respectively).
Housing, whether by rent or home prices, has seen far more appreciation than the other goods and services in the CPI: home price increases have doubled that of the overall CPI, and rents have increased around 50% more (depending on where you live, of course). A new report from CoreLogic takes a look at how inflation and rental prices work hand-in-hand.
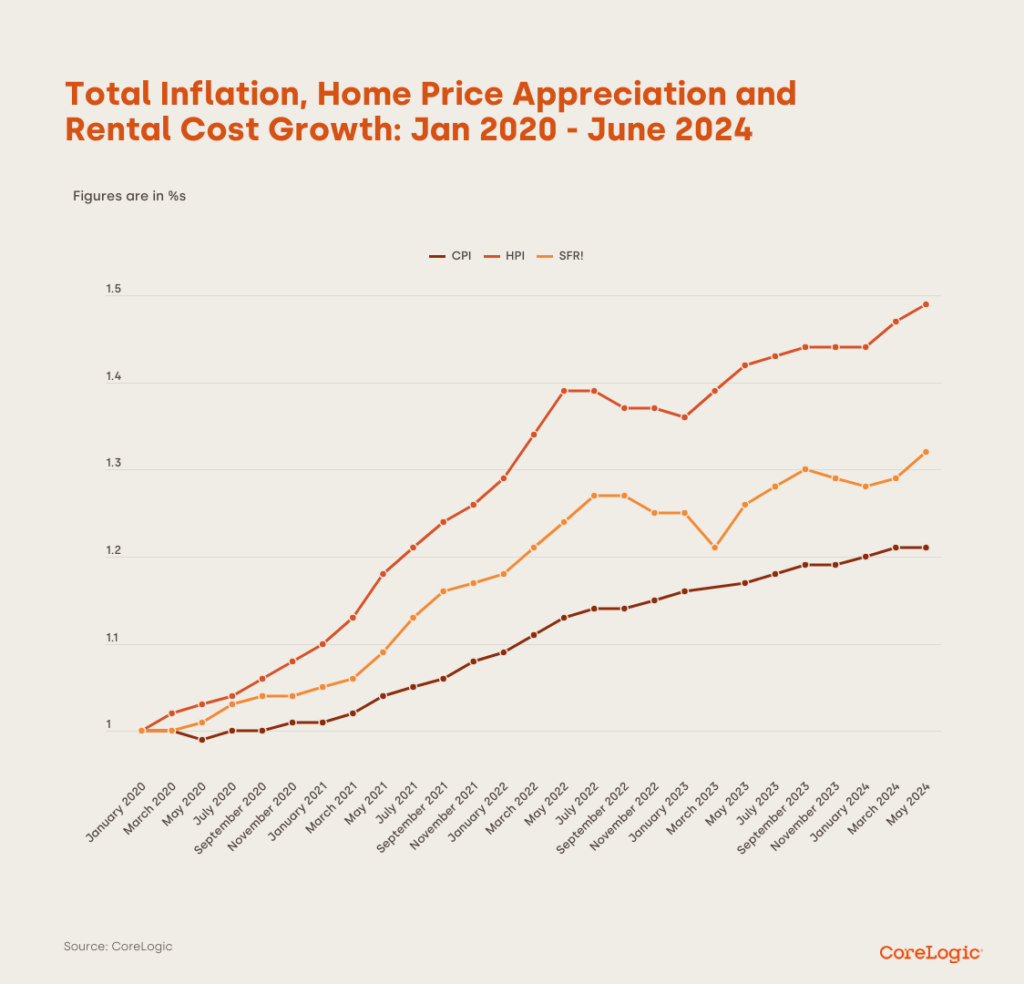
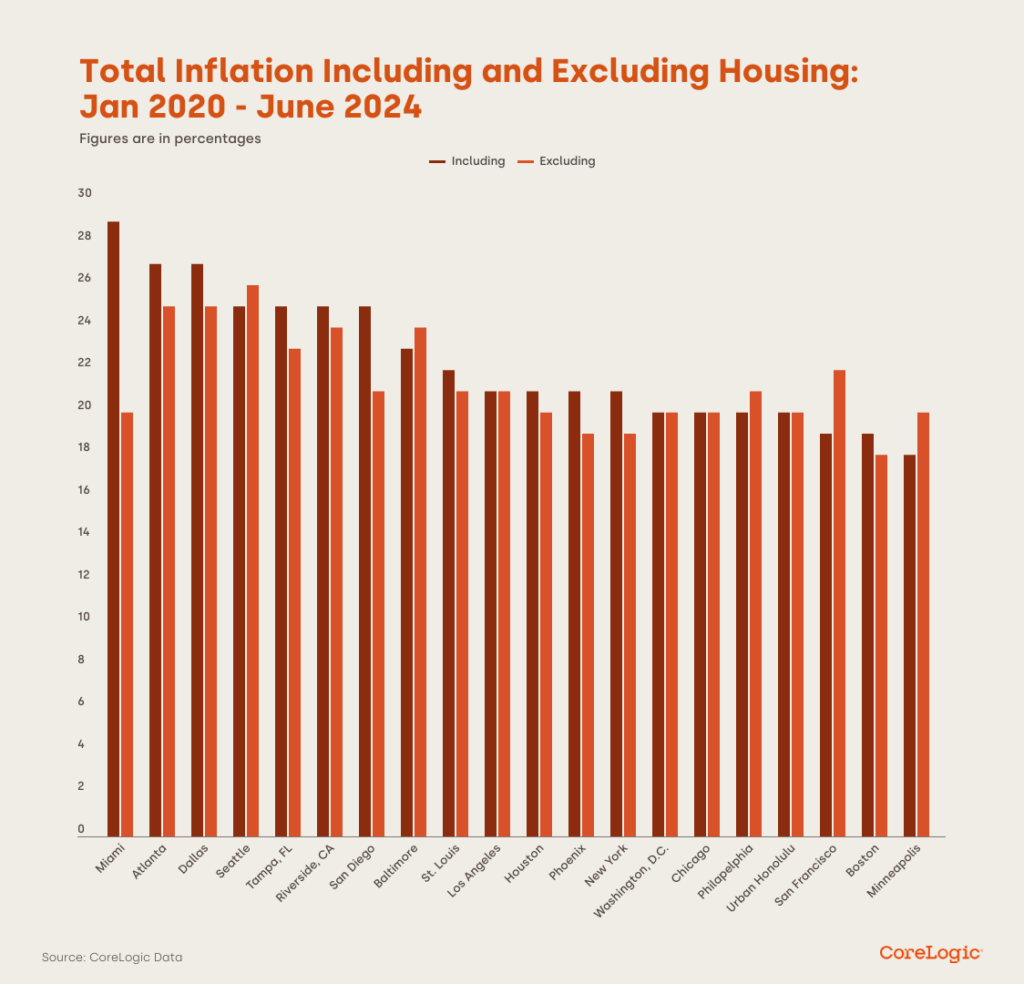
Figure 1 (above) shows the CoreLogic Home Price Index, the CoreLogic Single Family Rent Index, and the CPI for January 2020. The overall inflation number is calculated through a method that uses CoreLogic’s Single Family Rent Index to replace the typical measure of imputed rent for homeowners in the CPI. The huge variation is clear, with inflation ranging from 18% in Minneapolis to 30% in Miami. Geographically, the heaviest inflation has been in the South, with Miami, Atlanta, Dallas, and Tampa all showing inflation above 25%. Houston is the only Southern metro below that threshold, with inflation closer to the national average at 21%.
Also shown in Figure 2 (see below) is inflation for all goods and services besides housing. Here there’s slightly less variation, ranging from 18% in Boston to 26% in Seattle—inflation with housing included was higher in most places. Only in eight metros did housing inflation decrease the overall number, rather than pushing it up. These tended to be more expensive places that saw less appreciation and some population loss during the pandemic, such as San Francisco, Los Angeles, Seattle, and Honolulu.
These regional differences show just how differently inflation impacts people, and how wide-ranging peoples’ experiences can be. However, looking at inflation by geography is just one way to see things. For homeowners who have a fixed-rate mortgage or own their home free and clear, the housing appreciation component of inflation is almost not a factor; their experience will be much closer to the numbers for all other goods. Whereas for renters or first-time homebuyers, the overall number may not be reflective of buying habits that will more closely match rent and price indexes.
Click here for more on CoreLogic’s report on rental trends and inflation.


