


Residential mobility in the U.S. was significantly disrupted by the pandemic, with some changes proving to be short-lived while others are still shaping migration patterns in 2024. A new working paper from the Harvard Joint Center for Housing Studies breaks down five key ways that household moves changed during and after the pandemic, offering insight into broader trends that continue to reshape the current housing landscape.
1. A Brief Spike, Then a Continued Decline in Mobility
At the start of the pandemic, residential movement surged. In March 2020, temporary change of address requests rose 200% over the same month in 2019, while permanent requests increased 12%, according to the U.S. Postal Service. But this mobility boom was short-lived. By 2021 and 2022, change of address requests declined, continuing the long-term trend of falling residential mobility. By 2024, the household mobility rate dropped to a historic low of 8.2%, based on data from the Current Population Survey.
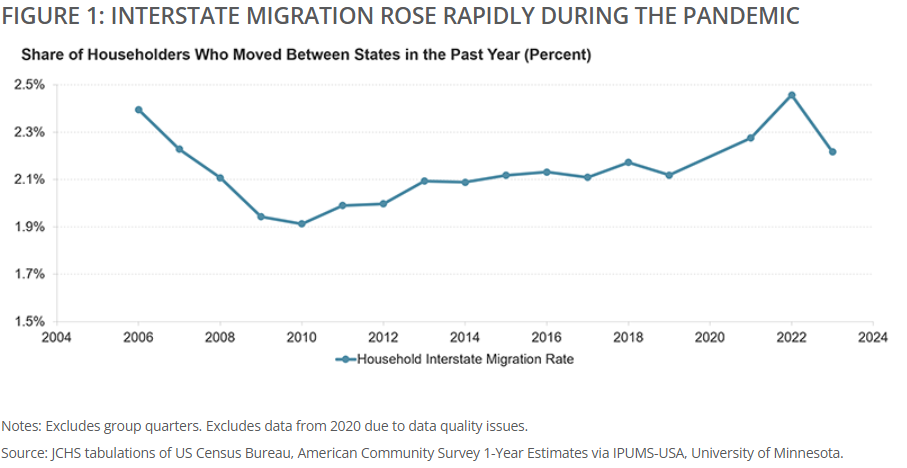
2. Interstate Moves Surged During the Pandemic, Then Settled Back Down
Interstate migration, which accounts for typically less than 20% of all moves, saw a rare spike. The interstate migration rate jumped to 2.3% in 2021 and 2.5% in 2022, surpassing pre-Great Recession levels. Remote workers drove the increase in 2021, while commuters followed in 2022. Overall, nearly 700,000 additional households crossed state lines during the pandemic than would have if the pre-pandemic rate of 2.1% had held steady. However, by 2023, the rate returned to 2.2%, matching pre-pandemic norms.
3. Homeowners With Low Rates Are Staying Put
A rush to buy homes during the low interest rate era led to a spike in homeowner moves (6.8% in 2021), up from 6.2% in 2019 and marking the highest in over a decade. But as rates rose in 2022, many homeowners found themselves locked in by favorable mortgage terms. By 2023, the homeowner mobility rate dropped sharply to 5.5%, dragging down overall movement even as renter mobility rebounded.
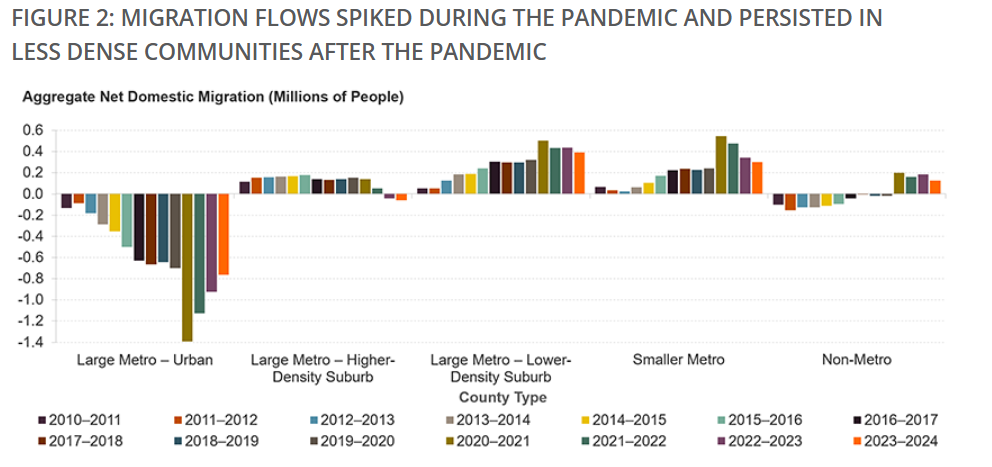
4. Migration to Low-Density Areas Has Persisted
One pandemic-era trend that hasn’t faded is the move to less dense areas. Net migration into lower-density suburbs, smaller metros, and non-metro counties rose sharply in 2020–2021, and those inflows remained elevated through 2024. Urban counties continued to see high outflows, while high-density suburban counties switched from net inflows to net outflows. Meanwhile, non-metro areas, which were previously losing residents, maintained net gains through 2024, reversing pre-pandemic patterns.
5. The Sunbelt Still Leads, But Other Regions Are Stirring
The Sunbelt continued its long-running dominance in domestic migration during and after the pandemic. States like Florida, Texas, North Carolina, and Arizona topped the charts for net inflows during the pandemic. Post-pandemic, Texas, Florida, North Carolina, and South Carolina remained top destinations. However, Midwest and Northeast states began showing signs of a shift, with some reducing outflows or even flipping to net inflows—possibly pointing toward a future uptick in migration to traditionally colder states.
While the overall mobility rate keeps declining, the pandemic left behind a series of localized and demographic shifts. Whether driven by remote work, housing costs, or lifestyle changes, these evolving patterns are already influencing housing markets and community planning, with effects likely to stretch well beyond 2024.
Click here for more on the Harvard Joint Center for Housing Studies’ report on U.S. migration.