The typical American home would only be worth $177,511 today if home prices had kept up with overall inflation since 1963—roughly 2.4 times less than the $431,000 it currently costs. According to a recent survey by Clever Real Estate, home prices are 24 times higher than they were in 1963, however inflation is only 10 times higher.
Inflation has risen by 31% in the last decade alone, whereas property prices have soared by 63% (from $264,800 to $431,000). So, of course, an estimated 73% of Americans believe that local housing prices are now unaffordable.
Key Findings:
- Home prices have increased twice as much as overall inflation since 2013.
- The median home price increased 63% over that period, while overall inflation rose 31%.
- If home prices kept pace with overall inflation since 1963, the median American home would cost only $177,511 today, instead of $431,000.
- Home prices today are 24x higher than they were in 1963, while inflation is 10x higher.
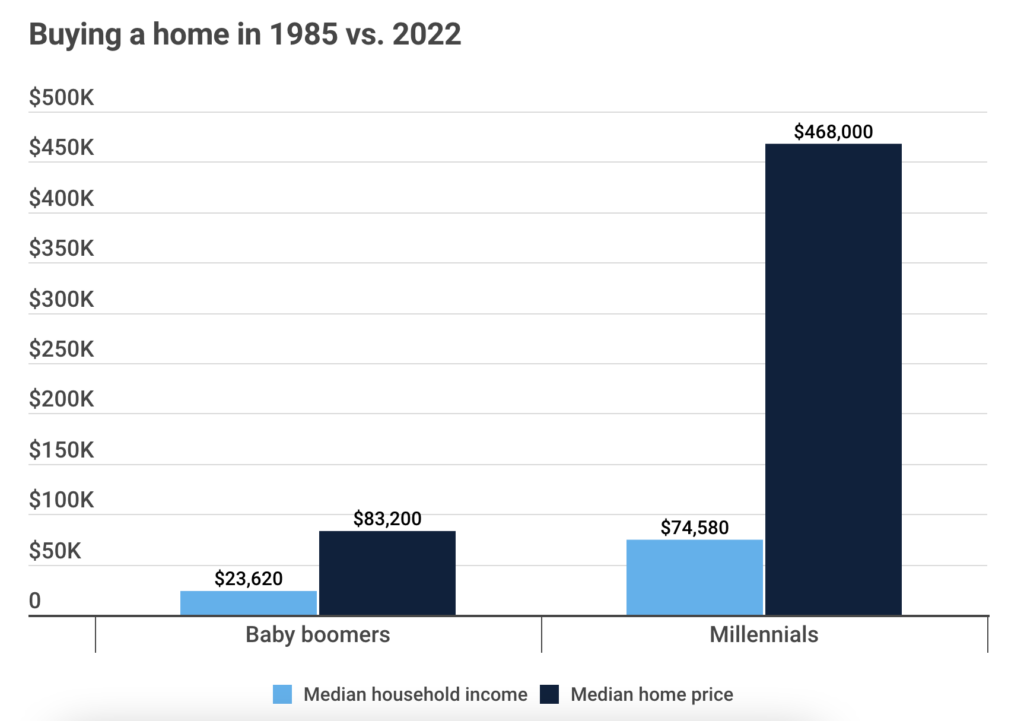
- Millennials pay nearly twice as much as baby boomers did for homes in 1985. Today, the typical home cost is equivalent to about 6.3 years’ worth of median household income, compared to 3.5 years in the mid-1980s.
- For homes to be as affordable today as they were in 1985, the median household would need to earn $134,000 per year—nearly double the actual median of $74,580.
- By 2050, the median home would cost 8.4x the median household income if the current trajectory continues.
- For the first time in 12 years, inflation rose faster than home prices in 2023.
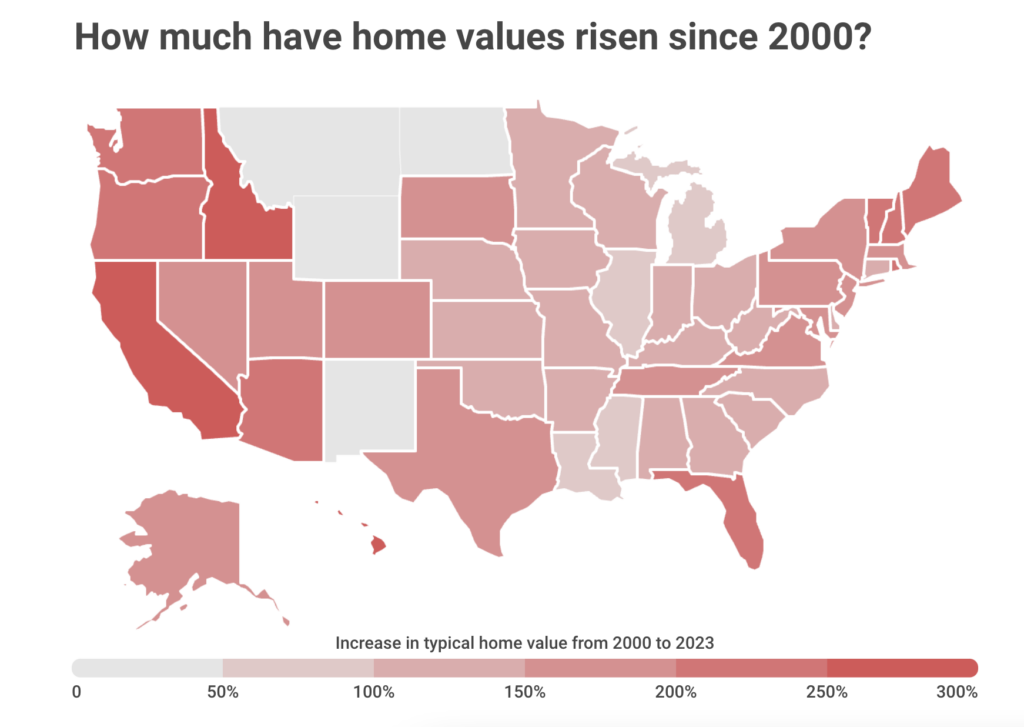
- Hawaii has seen the largest rise in home prices among all states since 2000, with the typical home value quadrupling to $831,808.
- Louisiana has seen the smallest price increase, though prices are still 86% higher than in 2000, up to $194,453 today.
- Of the 50 largest U.S. metros, Miami has seen the sharpest spike in home prices. The typical house in Miami is 4x more expensive today ($472,711) than it was in 2000.
- Cleveland has seen the smallest rise among the 50 largest metros—but there’s still been an increase of about $90,000 since 2000, with the typical home now valued at $211,496.

States With the Biggest Increases in Home Price:
- Hawaii (typical home value in 2023: $831,808)
- California ($743,435)
- Idaho ($432,307)
- District of Columbia ($603,852)
- Florida ($389,325)
- Maine ($379,933)
- Vermont ($373,709)
- Washington ($562,290)
- Oregon ($479,906)
- Rhode Island ($434,576)
States With the Smallest Increases in Home Price:
- Louisiana (typical home value in 2023: $194,453)
- Illinois ($247,948)
- Michigan ($228,329)
- Mississippi ($172,965)
- Ohio ($213,1490)
- West Virginia ($154,371)
- Nebraska ($245,663)
- Alabama ($216,564)
- Connecticut ($377,247)
- Iowa ($205,375)
Since 1985, incomes have increased 3.2 times while property prices have increased 5.6 times. It now takes 6.3 years’ worth of household income to buy a typical home, which is more than twice as long as it did in the 1980s (3.5 years).
Furthermore, the median household would now need to earn $134,000 annually—almost twice as much as the median of $74,580 in today’s dollars—in order to attain the same affordability of homes as in 1985. The primary reasons of this dilemma are the lack of available housing and the building of more elaborate, larger homes.
Metros With the Biggest Increases in Home Price:
- Miami
- Riverside, CA
- Los Angeles
- San Diego
- Tampa, FL
- San Jose, CA
- San Francisco
- Orlando, FL
- Sacramento, CA
- Seattle
- Providence, RI
- Phoenix
- Portland, OR
- Nashville, TN
Fourteen of the 50 biggest metro regions in the U.S. have seen at least a three-fold increase in the average home price since 2000. Cleveland’s housing prices have climbed the least (78%), and Miami’s have increased the highest (a whopping 299%). Hawaii has experienced the most state-level gains in housing prices (309%) since 2000, while Louisiana has experienced the lowest (86%).
For the first time since 2011, inflation increased more quickly in 2023 than home prices, despite the fact that historically, U.S. home values have greatly outperformed inflation. Inflation increased 3.3% while home prices increased 2.6%.
Millennials vs. Boomers: Why Millennials Pay Nearly 2x More for Homes
In the past, home prices have increased faster than the average American’s salary due to outstanding demand. Homes are now far less affordable for younger Americans than they were for older generations as a result of this trend.
When you account for average salary, homes for millennials are actually almost twice as expensive as they were for baby boomers in their 30s. Around 1985, when boomers were in their 30s, the median home’s price was 3.5 times higher than the median household income. At $23,620 per household, the median income was more than the typical property price of $83,200.
The typical home price was 6.3 times more than the median household income in 2022, when the majority of millennials were in their 30s. The typical price of a property was $468,000, while the median household income was $74,580. The increase from 3.5 to 6.3 years’ worth of salary indicates that millennials’ homes are 80% more expensive than those of their parents’ age.

In 1985, the median household would have to earn $134,000 annually, which is over twice as much as the current median of $74,580, in order for homes to be as inexpensive as they were.
The median home in 2030 would cost 6.9 times the median household income if the trend keeps going at its current rate. The median home’s cost by 2050 would be 8.4 times that of the median household income.
Home prices have typically outpaced inflation, but 2023 was an exception to the rule. Inflation increased by roughly 3.3%, but home prices increased by just 2.6%. While this recent shift is insufficient to reverse decades of home price rise outpacing inflation, it does indicate that, at least for the time being, home prices are not rising faster than inflation as they have in the past.
To read the full report, including more data, charts, and methodology, click here.


