According to ATTOM’s year-end 2023 U.S. Home Flipping Report, an estimated 308,922 single-family homes and condominiums were flipped across the nation in 2023. This represents the worst year decline since 2008, down 29.3% from 436,807 in 2022.
ATTOM data also shows that the percentage of total home sales that were flips fell from 8.6% in 2022 to 8.1% last year, coinciding with the drop in the number of homes flipped by investors. Quick buy-renovate-and-resell projects experienced a decline in profitability and profit margins, which is another indication that the home-flipping business is experiencing a challenging period.
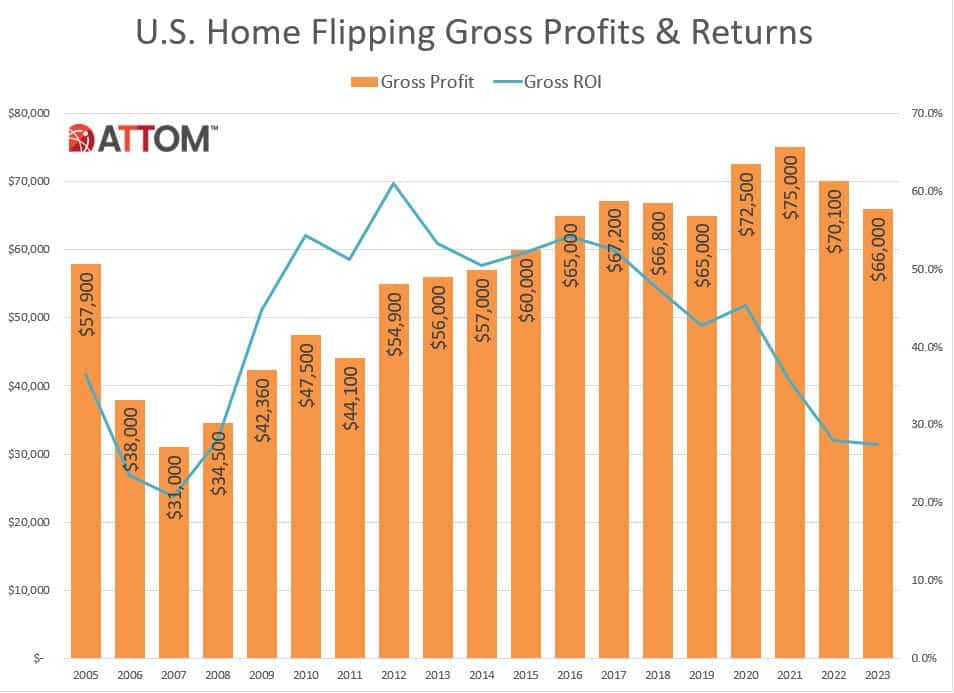
In 2023, gross earnings (the difference between the median sales price and the median amount originally paid by investors) on typical home flips countrywide fell to $66,000. That represented only a 27.5% return on investment over the initial buying price, down from $70,100 in 2022. The most recent national return on investment (ROI) fell to its lowest point since 2007 (before taking into consideration mortgage interest, real estate taxes, remodeling costs, and other holding costs). It was down from 28.1% in 2022 and 35.7% in 2021.
The median price of the houses investors flipped dropped marginally faster than the median price they paid to buy the properties (approximately 4.4% vs. 4%), causing investors to see a decline in their profit margins for the sixth time in the previous seven years.
Key Findings from Q4 of 2023:
- An estimated 52,701 investors executed 65,656 house flips in the fourth quarter of 2023, or 1.25 flips per investor.
- In Q4 of 2023, some 36.1% of all properties flipped were bought by investors using financing; this percentage was up from 34.4% in the same period of 2022 but decreased from 37.2% in the preceding quarter.
- The percentage of the share bought with cash increased to 63.9% in the Q3 of 2023, up from 62.8% in Q4 of 2022, but down from 65.6%.
- In Q4 of 2023, the gross-flipping profit on median-priced home flips was $65,000, up from $59,900 in the same period the previous year but down from $68,154 in Q3. The most recent data showed an average return on investment (as a proportion of the purchase price) of 27.7%. That was higher than 24.4% during the same period in 2022 but lower than 28.8% in the preceding quarter.
- The ROI’s quarterly decline, which is typical for that time of year, came after gains in 2023’s second and third quarters.
- The average time to execute a home flip in Q4 of 2023 was 156 days, compared to 165 days in the same period in 2022.

“In 2023, the landscape for home flipping across the U.S. became increasingly challenging,” remarked Rob Barber, CEO at ATTOM. “Whether the overall market has soared or seen just modest gains in recent years, investors have missed out on the action.”
“The sharp decline in the number of home flips likely reflected a combination of dwindling returns and a tight supply of homes for sale,” he continued. According to Barber, in either case, a substantial financial reworking will be necessary for “house flipping fortunes to turn back around.”
The nation’s decade-long home-price runup started to stall in the year that saw the most recent decline in home-flipping profits. This resulted in the smallest yearly price growth since 2012 and a tiny decline in profits for sellers of all kinds. But during prior years when the overall housing market was flourishing, home flippers’ margins had already begun to decline. The profit differential between investors and all sellers progressively increased as a result. In 2023, average returns stayed at levels that were readily negated by carrying expenses associated with restoration and repair, which typically account for 20 to 33% of the sale price.
Home Flipping Rates Fall in Most Housing Markets, with Biggest Declines in the South and West
In 112 of the 212 metropolitan statistical areas examined in the research, the percentage of home flips as a percentage of all home sales fell from 2022 to 2023 (53%). The South and West saw the top 25 biggest drops in annual flipping rates.
They were led by:
- Gainesville, GA (rate down from 15.1% in 2022 to 9.9% in 2023)
- Phoenix (down from 16.3% to 11.9%)
- Prescott, AZ (down from 9.8% to 6%)
- Charlotte, NC (down from 14.2% to 10.6%)
- Provo, UT (down from 10.9% to 7.5%)
The largest declines in flipping rates in metro areas with a population of one million or more occurred in Las Vegas (rate decreased from 12.2% to 8.9%); Sacramento, CA (down from 9.9% to 6.9%); and Tucson, AZ (down from 14.6% to 11.8%), aside from Phoenix and Charlotte.
The following metro areas had higher rates of home flipping in 2022–2023: Columbus, GA (up from 10.9% to 13.5%); Macon, GA (rate up from 12.1% to 17%); Gulfport, MS (up from 3.9% to 7.7%); Jackson, MS (up from 5.8% to 8.4%); and Dayton, OH (up from 10% to 12.4%).
Home Flips Purchased with Financing Tick Upward
The share of flipped homes that were first bought by investors using finance rose to 36.5% nationwide in 2023 from 35.7% in 2022 and 36.2% in 2021. Whereas, 63.5% of properties that were flipped in 2023 were initially purchased entirely with cash, a decrease from 64.3% in 2022 and 63.8% in the previous two years.
With enough data to examine, metropolitan regions with a population of one million or more had the greatest percentage of flipped homes bought by investors using loans in 2023.
These areas included:
- San Diego (56.4%)
- Seattle (56.1%)
- Fresno, CA (52.2%)
- Providence, RI (49.2%)
- Boston (48.6%)
In that same group, the metro areas with the highest percentage of flips purchased with all cash included Detroit (81.6%); Cleveland (76.3%); Buffalo, NY (75.5%); Pittsburgh (71.1%) and Birmingham, AL (70.2%).
Typical Gross Profits on Home Flips Decline in Nearly Two-Thirds of Nation
In 2023, the average price at which homes were sold across the country was $306,000. This resulted in a gross flipping profit of $66,000, which was higher than the median original purchase price of $240,000 paid by investors. The national gross profit decreased from $75,000 in 2021—the greatest amount this century—to $70,100 in 2022.
With a population of one million or more, the 56 metro regions in the United States that had the highest gross flipping profits on median-priced deals in 2023 were:
- San Jose, CA ($275,250)
- San Francisco ($170,000)
- Boston ($158,000)
- New York ($154,750)
- San Diego ($153,000)
The weakest gross flipping profits among metro areas with a population of at least 1 million in 2023 were in Austin, TX ($18,640 loss); San Antonio ($12,289 profit); Dallas ($14,817 profit); Houston ($16,932 profit) and Phoenix ($25,000 profit).

Returns on Home Flipping Fall in Two-Thirds of Metro-Area Markets
The average profit margin on home flips in the United States decreased to 27.5% last year, representing the lowest return on investment since 2007. Nationwide, the return on investment (ROI) for median-priced home flips has decreased by 18 percentage points since 2020 and by 27 points since 2016.
The typical national selling price of flipped homes decreased by 4.4% from $320,000 in 2022 to $306,000 in 2023, resulting in yet another decline in margins. That was slightly less than the 4% decline in the initial purchase price ($249,900 in 2022 against $240,000 in 2023) that investors had made for the properties they had flipped.
Among metro areas with a population of at least 1 million, the biggest gross profit margins in 2023 were in Pittsburgh (105.3%); Buffalo, NY (87.4%); Baltimore (75.5%); Richmond, VA (75.1%) and Philadelphia (74.3%). The worst came in Austin, Texas (4.1% loss); Dallas (4.4% profit); San Antonio (5% profit); Salt Lake City (6.2% profit) and Houston (6.2% profit).
Average Time to Flip Homes Nationwide Increases
The average time for house flippers who sold their properties in 2023 was 169 days, or around five and a half months. For residences flipped, that was an increase from 165 days in 2022 and 158 days in 2021.
FHA Homebuyers Purchase Larger Share of Flipped Homes
Of the 308,922 houses that were flipped in the U.S. in 2023, 10.8%, or one in every nine, were sold to purchasers who used a Federal Housing Administration (FHA)-backed loan. That was an increase from 8.1% in 2021 and 8.3%—or one in 12—in 2022.
The metro areas with the highest percentage of flipped homes sold to FHA buyers in 2023—typically first-time homebuyers—were Merced, CA (29.3%); Modesto, CA (25%); Visalia, CA (24.7%), Bakersfield, CA (24.6%), and Kennewick, WA (23.7%) out of 212 metro areas with a population of at least 200,000 and at least 100 home flips in 2023.
To read the full report, including more data, charts, and methodology, click here.


