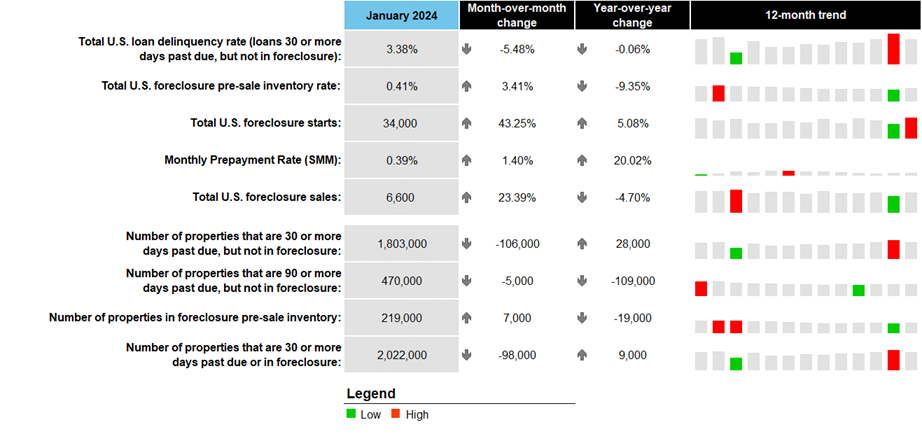
According to ICE’s first look at January’s mortgage performance, as expected, seasonal trends materialized and numbers rebounded from December’s calendar-driven rise as the national delinquency rate dropped to 3.38% in January, the lowest level recorded since October and flat from the same time last year.
Across the board, past-due mortgages were down as inflows and rolls to later stages of delinquency fell, while early- and late-stage delinquency cures improved.

The number of loans in active foreclosure rose 7,000 to 219,000 but remained 23% below, or down –64,000 files, from pre-pandemic levels.
7.2% of the months serious delinquencies were foreclosure starts, a number that was last seen in April 2022 and marked a 43.3% month-over-month jump.
“Foreclosures affect neighborhood conditions, so you need the best and most knowledgeable local resources to support you. Having the right tools in place before the increase in foreclosures will help servicers respond quickly and effectively,” said Elspeth Spransy, VP of Field Services, SingleSource Property Solutions. “Now is the time to ensure that property preservation service vendors are ready to perform in this highly regulated environment.”
Loans that were 90-days past due or more (but not in active foreclosure), known as a serious delinquency, were down by 109,000 files, or 19% year-over-year, with number of serious delinquencies sitting at around 470,000 mortgages.
There were also 6,600 completed foreclosure sales were completed nationally in January, a 23% increase, a number which is in-line with monthly averages from 2023.
While January’s jump in foreclosures is worth watching, serious delinquencies remain low, with 70% of such loans still protected from foreclosure, reducing near-term risk. Prepayment activity rose marginally as recently easing interest rates in December and January provided a modest increase in refinance incentive and homebuyer demand

Early Delinquency/Foreclosure Data for January
Data as of Jan. 31, 2024:
Total U.S. loan delinquency rate (loans 30 or more days past due, but not in foreclosure): 3.38%
- Month-over–month change: -5.48%
- Year-over-year change: -0.06%
Total U.S. foreclosure pre-sale inventory rate: 0.41%
- Month-over-month change: 3.41%
- Year-over-year change: -9.35%
Total U.S. foreclosure starts: 34,000
- Month-over-month change: 43.25%
- Year-over-year change: 5.08%
Monthly prepayment rate (SMM): 0.39%
- Month-over-month change: 1.40%
- Year-over-year change: 20.02%
Foreclosure sales: 6,600
- Month-over-month change: 23.39%
- Year-over-year change: -4.70%
Number of properties that are 30 or more days past due, but not in foreclosure: 1,803,000
- Month-over-month change: -106,000
- Year-over-year change: 28,000
Number of properties that are 90 or more days past due, but not in foreclosure: 470,000
- Month-over-month change: -5,000
- Year-over-year change: -109,000
Number of properties in foreclosure pre-sale inventory: 219,000
- Month-over-month change: 7,000
- Year-over-year change: -19,000
Number of properties that are 30 or more days past due or in foreclosure: 2,022,000
- Month-over-month change: -98,000
- Year-over-year change: 9,000
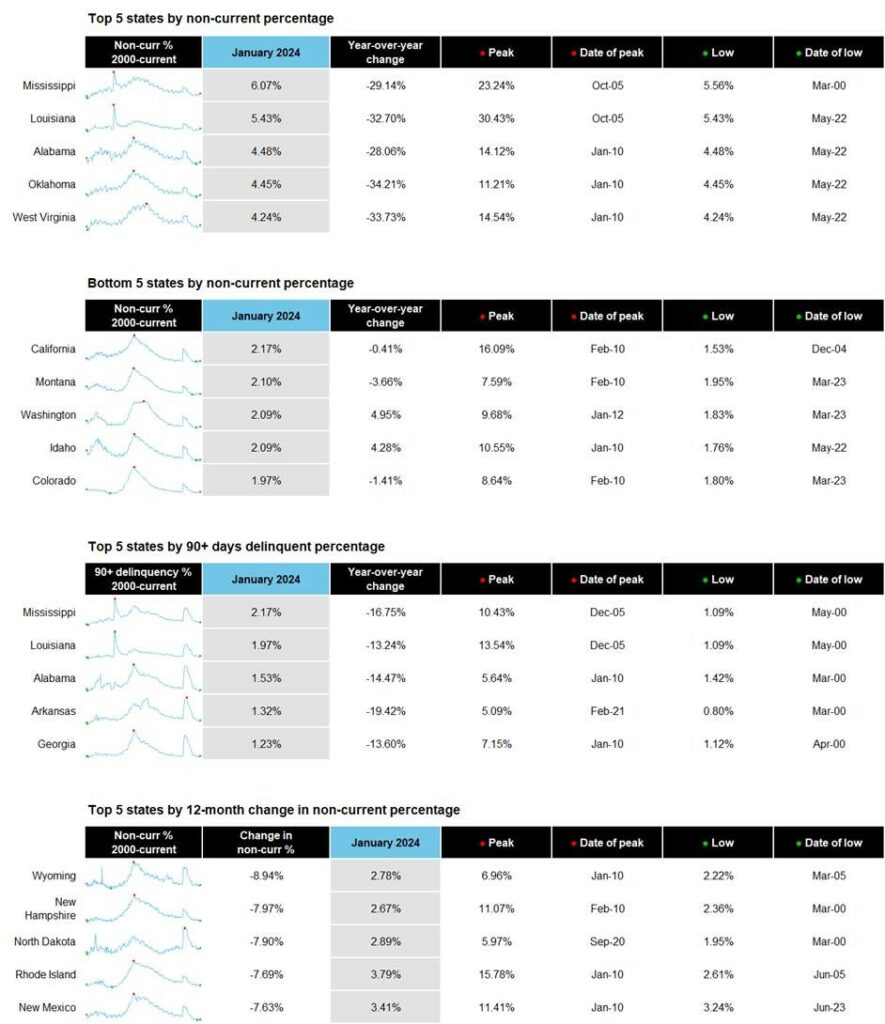
Top 5 States by Non-Current Percentage:
- Mississippi: 6.07%
- Louisiana: 5.43%
- Alabama: 4.48%
- Oklahoma: 4.45%
- West Virginia: 4.24%
Bottom 5 States by Non-Current Percentage:
- California: 2.17%
- Montana: 2.10%
- Washington: 2.09%
- Idaho: 2.09%
- Colorado: 1.97%
Top 5 States by 90+ Days Delinquent Percentage:
- Mississippi: 2.17%
- Louisiana: 1.97%
- Alabama: 1.53%
- Arkansas: 1.32%
- Georgia: 1.23%
Top 5 States by 12-Month Change in Non-Current Percentage:
- Wyoming: -8.94%
- New Hampshire: -7.97%
- North Dakota: -7.90%
- Rhode Island: -7.69%
- New Mexico: -7.63%
Bottom 5 States by 12-Month Change in Non-Current Percentage:
- South Dakota: 8.66%
- Louisiana: 6.06%
- Arizona: 5.64%
- Tennessee: 4.98%
- Washington: 4.95%
“This is a sign that inflationary pressures are finally hitting housing,” Donna Schmidt,
Founder and Managing Partner, DLS Servicing. “It will be critical for mortgage servicers to beef up their loss mitigation outreach, not just for home retention options but also for short sales and deeds in lieu of foreclosure. A robust, well-rounded loss mitigation approach will help to reduce potential servicing losses. But servicers must be proactive and persistent through the foreclosure process.”


