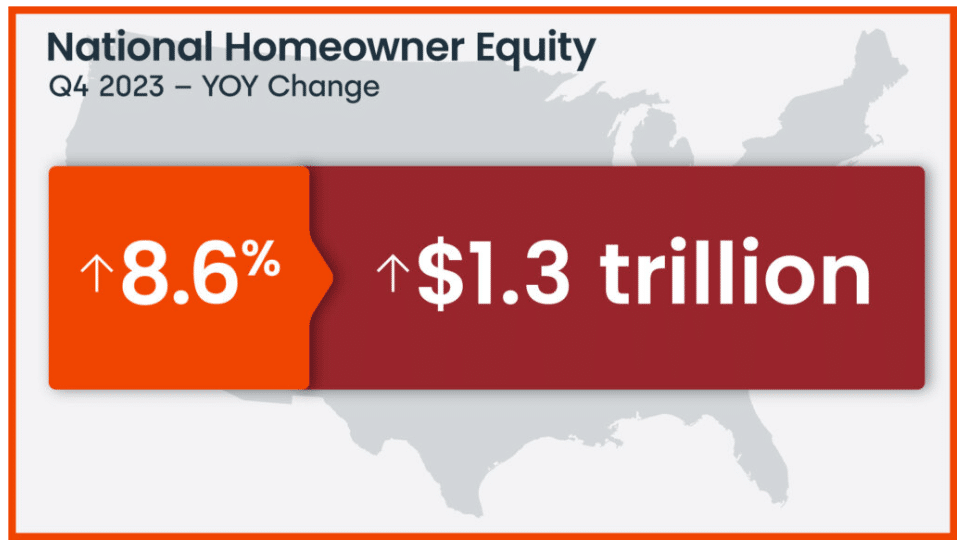
CoreLogic’s latest Homeowner Equity Report (HER) for the Q4 of 2023 shows that U.S. homeowners with mortgages (which account for roughly 62% of all properties) saw home equity increase by 8.6% year-over-year, representing a collective gain of $1.3 trillion, and an average increase of slightly more than $24,000 per borrower since Q4 of 2022. This brought total net homeowner equity to more than $16.6 billion at the of 2023.

Positive gains in home equity
Home equity gains continued in Q4, providing owners with a solid financial cushion, particularly for baby boomers who have been in their homes for a while and have accumulated substantial equity.
Three Northeastern states posted the country’s highest annual equity gains in Q4:
- Rhode Island ($62,000)
- New Jersey ($55,000)
- Massachusetts ($53,000)
The equity growth in those states was due in part to the recent healthy home price increases in that area of the country. According to CoreLogic’s latest Home Price Insights report, Rhode Island and New Jersey led the nation for year-over-year appreciation in January, a respective 13.2% and 11.6%.
“Rising home prices continue to fuel growing home equity, which, at $298,000 per average borrower remained near historic highs at the end of 2023,” said Dr. Selma Hepp, Chief Economist for CoreLogic. “By extension, at 43%, the average loan-to-value ratio of U.S. borrowers has also remained in line with record lows, which suggests that the typical homeowner has notable home equity reserves that can be tapped if needed.
Where are the underwater homes?
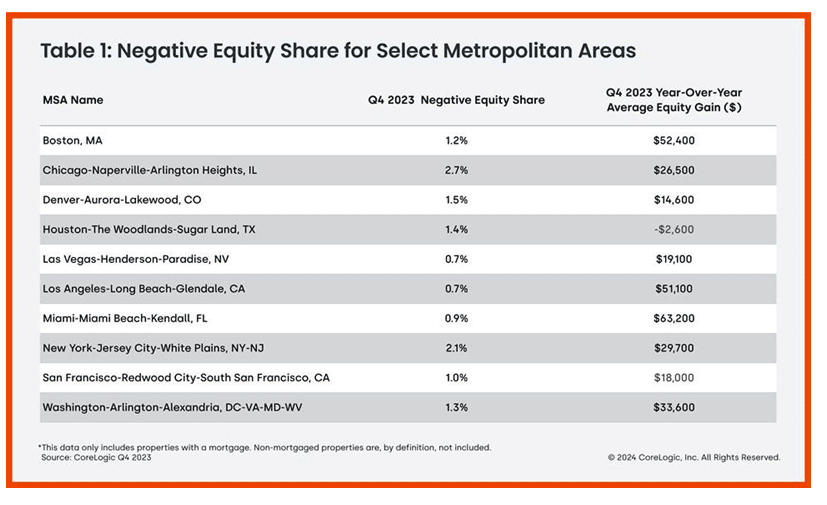
Negative equity, also referred to as underwater or upside-down mortgages, applies to borrowers who owe more on their mortgages than their homes are currently worth. As of Q4 of 2023, the quarterly and annual changes in negative equity were:
- Quarterly change: From Q3 of 2023 to Q4 of 2023, the total number of mortgaged homes in negative equity decreased by 1.1%, to one million homes or 1.8% of all mortgaged properties.
- Annual change: From Q4 of 2022 to Q4 of 2023, the total number of homes in negative equity decreased by 15%, from 1.2 million homes or 2.1% of all mortgaged properties.
“More importantly, home price growth over the last year has helped lift the equity of homeowners who were underwater because of 2022 price declines–meaning that their mortgage amount was higher than the value of their properties,” added Dr. Hepp. “Now, slightly more than one million borrowers are underwater, the lowest number recorded in CoreLogic historic data and significantly below the 12 million seen coming out of the Great Recession.”

Because home equity is impacted by home price changes, borrowers with equity positions near (+/- 5%), the negative equity cutoff, are most likely to move out of or into negative equity as prices change, respectively. Looking at the Q4 of 2023 book of mortgages, if home prices increase by 5%, 114,000 homes would regain equity; if home prices decline by 5%, 162,000 properties would fall underwater.

CoreLogic determined the amount of equity for each property by comparing the estimated current value of the property against the mortgage debt outstanding (MDO). If the MDO is greater than the estimated value, then the property is determined to be in a negative equity position. If the estimated value is greater than the MDO, then the property is determined to be in a positive equity position. The data is first generated at the property level and aggregated to higher levels of geography. CoreLogic uses public record data as the source of the MDO, which includes more than 50 million first- and second mortgage liens and is adjusted for amortization and home equity utilization in order to capture the true level of MDO for each property.


