According to a new study from Point2Homes, many people believe that earning $1 million is an unrealistic dream, but an increasing number of American families are achieving it. But, just how many more? Point2’s most recent examination of IPUMS data revealed a whopping 446% increase in millionaire owner households in the U.S., from 30,000 in 2017 to more than 136,000 in 2022.
This indicates that households with at least $1 million in income from various sources (including salary, income from an estate or trust, interest, dividends, royalties, and rentals received, among others) are on the rise.
With an estimated 322,356 people living in 136,697 millionaire, owner-occupied homes, it seems that ultra-wealthy homeowners are among the fastest rising income groups in the country. Not only did the number of households quadruple between 2017 and 2022, but the number of people living in these households increased more than fourfold during the same five-year period.
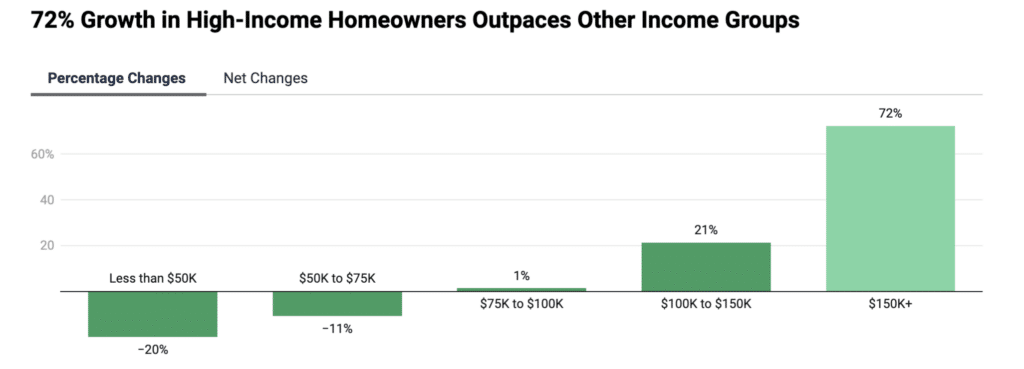
However, not all who live in a millionaire owner-occupied household are millionaires. Nonetheless, the financial and social benefits of living in a household in the 99th percentile are apparent. Analyzing the net and percentage changes in all income levels, it appears that it is not just the small group of millionaire owners that is increasing: Because of rising salaries, the number of households in other high-income groups is increasing, while the number of families earning less than $75,000 is declining.
In terms of net income, it’s undeniable that many owner households still earn less than $50,000. However, examining the patterns, changes, and particularly the trades across groups reveals that, between 2017 and 2022, many households updated their salaries and (hopefully) their quality of life.
Who Are the People Living the “Ultra-Rich” Life?
Wealthy owner households—those earning $150,000 or more—grew by 9 million between 2017 and 2022, a 72% rise. The more glamorous subset of wealthy owner households grew at an incomparably quicker rate, more than quadrupling in the same period.
But who lives in these households? Who are the newest and luckiest members of the millionaire club, which includes the country’s wealthiest families?
- Gen Xers: The “average” millionaire in the U.S. belongs to Generation X. He or she is 50 years old and, along with their family, owns a 10-room, five-bedroom home worth approximately $1.8 million. In addition, their garage houses about three cars, and they are most likely a CEO or a physician.
- Baby boomers: Although Baby boomers used to have the highest proportion of ultra-wealthy owners, younger generations are catching up and even outpacing them. With a 37.4% share, Gen X currently leads the hyper-exclusive club. Baby boomers increased to over 93,000, accounting for 28.9% of all millionaire owners in the country, while 63,000 millennial millionaires (up from 9,000 in 2017) account for 19.7% of all ultra-high earners.
Baby boomers led the way in 2017, but five years later, Gen X has the most millionaire homeowners, followed by the millennial cohort.
However, there is a little gender gap: Millionaire households have roughly similar proportions of high-income men and women. Additionally, the report found that married couples make up the bulk of wealthy owners—nearly two out of every 10 are single.
Data suggests that Gen Z millionaire owners account for 10% of all high-income owners in the U.S. Instead, this large proportion is most likely attributed almost exclusively to people aged 15 to 24 who still live with their (rich) owner parents. Unfortunately, living in a rich owner’s family does not make you a millionaire—but it does come with some big benefits.

Where Do Millionaire Homeowners Live?
The answer is simple: coastal hubs.
Millionaire households are most concentrated in metropolitan areas such as New York, San Francisco, Los Angeles, Boston, and Washington, D.C. For example, in the New York metropolitan area alone, 26,561 households earn at least $1 million.
Top Five Metros with the Most Millionaire Households:
- New York-Newark-Jersey City, NY-NJ-PA (26,561 millionaire households)
- Los Angeles-Long Beach-Anaheim, CA (10,762)
- Chicago-Naperville-Elgin, IL-IN-WI (4,750)
- Dallas-Fort Worth-Arlington, TX (2,648)
- Houston-The Woodlands-Sugar Land, TX (2,863)
Salary is most likely just one of many sources of income for these extremely wealthy households, but achieving six-figure wages is no easy achievement. So, what do the millennials, Gen Xers, and baby boomers who live in these wealthy households do every day?
As one might assume, many of them are CEOs, judges, lawyers, and doctors. However, there are plenty of software developers, engineers, and managers, as well as athletes, data scientists, statisticians, insurance sales representatives, and inspectors.
What Homes Do Millionaire Homeowners Prefer?
Again, the answer is simple: the largest homes they can afford.
And, because we’re talking about millionaires, we’re leaving the realm of condos, single-family homes, and even penthouses to join the world of the mansion. The typical millionaire’s residence will contain ten rooms, implying that some wealthy families will have slightly less square footage at their disposal, but others will walk about mega-mansions with even more bedrooms, bathrooms, and dressing rooms.
The average millionaire would also value their property at roughly $1.8 million, though this value varies widely depending on the city: Millionaires in San Francisco, Los Angeles, and San Diego estimate that their homes are worth more than $2.5 million, whereas the ultra-rich in San Antonio-New Braunfels, TX, Pittsburgh, and Cincinnati feel their residences are worth less than $1 million.
Granted, with large money and big houses come big lifestyles and big bills. And, according to certain financial evaluations, these lifestyles may be genuinely costing them.
More money does not usually imply more savings. Rather, it just implies larger homes with higher mortgages and upkeep costs; more automobiles; far more expensive schools; and more extravagant lifestyles, all of which eat up more of the family’s large budget.
To read the full report, including more data, charts, and methodology, click here.


