As the weather warms up, potential buyers looking for homes this spring are experiencing different levels of market heat depending on where they look. In a new report, Zillow’s market analysis highlights the importance of housing inventory throughout the U.S.
“Shoppers in the market today should expect competition, especially for attractive listings on the lower end of the price range—a rare opportunity these days,” said Skylar Olsen, Chief Economist at Zillow. “That’s kept prices ticking upward in most areas, despite affordability challenges. There are places where new construction relieved some pressure, and where homeowners are less locked into their mortgage, but not in the nation’s most expensive metros. In costly areas, homeowners hold extensive mortgage debt at previously low rates, and the pressure is dialed up even further.”
Taking A Look at Regional Home Value Growth
The average home in the U.S. now costs $355,696, a 42.4% increase over pre-pandemic levels. The average monthly mortgage payment—assuming 20% down—is $1,851. That’s up 108%, or more than double, since before the outbreak. Overall, the average mortgage payment is up 7.1% over the previous year.
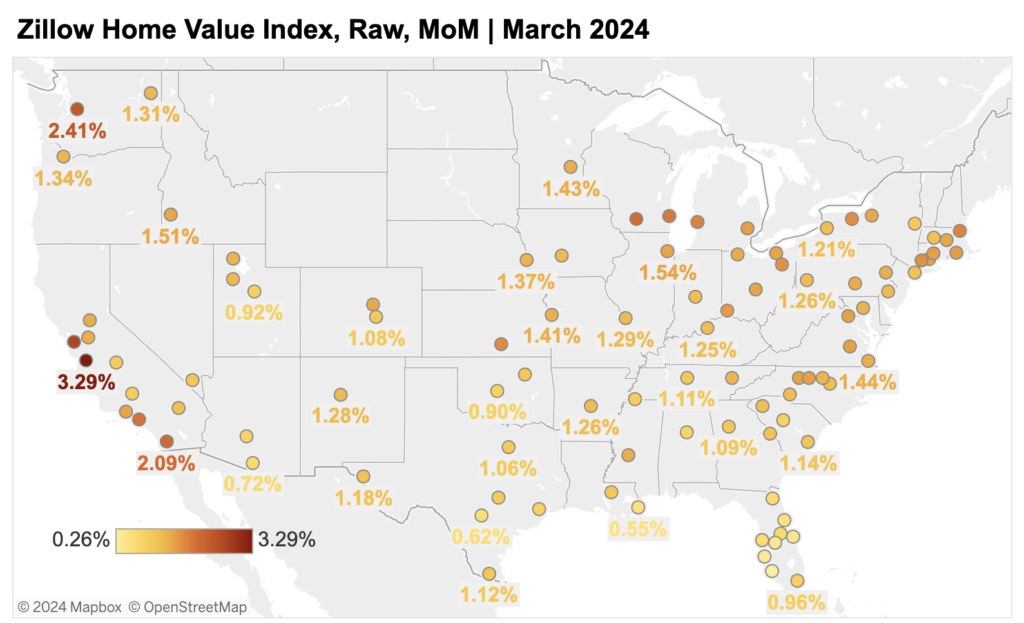
The most costly metropolitan metros—all of which are West Coast tech hubs—are the ones experiencing the fastest seasonal home value gains in the nation. Buyers in the most costly major U.S. metro areas are seeing prices rise faster than elsewhere. Monthly home value rise is strongest in coastal California metros and Seattle, peaking at 3.3% in San Jose. San Francisco, Seattle, San Diego, and Los Angeles follow, all with price increases of 2% or more.
These five metropolitan areas are the most expensive among the 50 largest in the U.S. It’s no coincidence that these are the places where the majority of homeowners are most likely stuck into their mortgages. That’s because buying now is significantly more expensive.

Bidding wars are typical in these markets, which all placed in the top ten for the percentage of homes sold above asking price in February, according to the report. Buyers are fighting for fewer options; all of these metros have experienced below-average inventory recovery compared to pre-pandemic levels.
Meanwhile, Southern metros are seeing modest appreciation since current inventory has expanded or virtually recovered since the outbreak began. New Orleans, San Antonio, Tampa, FL, Orlando, FL, and Jacksonville, FL, are the metros with the slowest—but still rather substantial—rise, with a monthly appreciation of just over 0.5%.
New construction is offering pressure relief in some metros, giving buyers a chance to move up. New listings for existing properties have increased from pre-pandemic levels in New Orleans and Austin, Texas, while San Antonio and the Florida metros mentioned above have had some of the smallest drops.
Recovering inventory in these areas has helped to reduce competition and keep price increases in check. New Orleans, Austin, Texas, and San Antonio are the three locations where buyers have more options than before the outbreak, while Florida metros Tampa, Orlando, and Jacksonville are down only 9%—tied for the second-smallest decrease.
New Listings Jump MoM, YoY
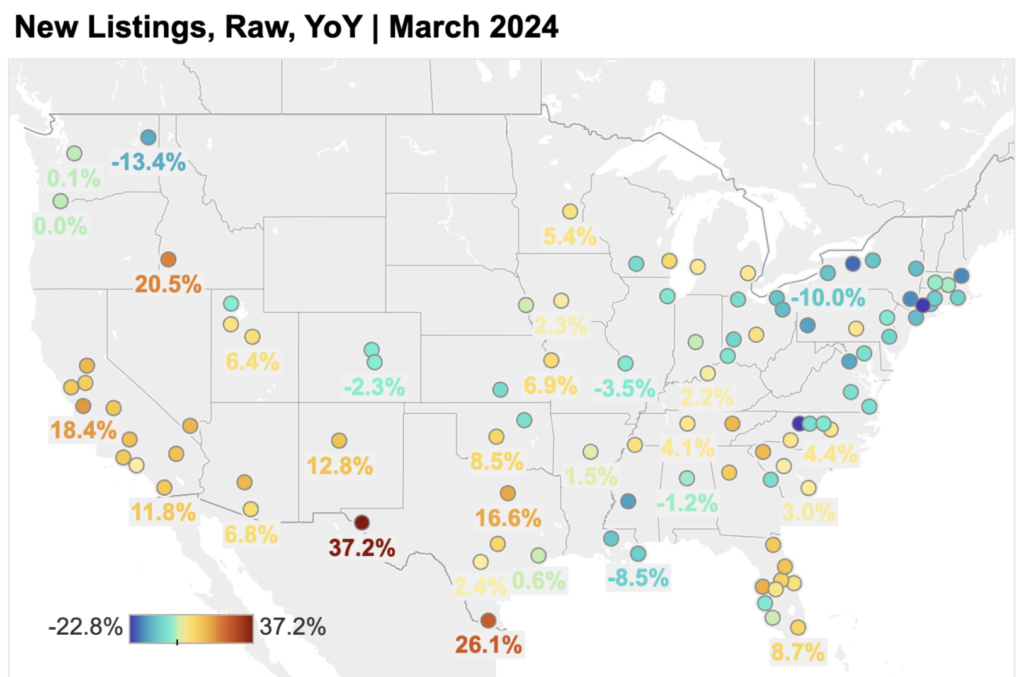
In March, new listings rose by 15.5% month-over-month (MoM) and 3.7% year-over-year (YoY). New listings are down 25.4% from pre-pandemic levels. Much of the progress achieved in February to recover from the severe pandemic inventory hole has been lost.
Total inventory (the number of active listings at any given point during the month) climbed by 7% in March compared to February. There were 12.2% more active postings in March than last year.
Inventory levels are 36.4% lower than pre-pandemic levels this month. Inventory increased annually in 36 of the 50 largest U.S. areas, with the most growth in Tampa, FL (38%), Dallas (37.8%), and Orlando, FL (33.2%). Year-over-year, inventory decreased the greatest in the New York City metro region (-14.8%), Las Vegas (-14.4%), and Buffalo, NY (-10.6%).
The metros with the most sellers returning to the market compared to last year are San Jose, CA (up 18.4%), Dallas-Fort Worth, Texas (16.6%), and Tampa, FL (15.4%). The markets with the fewest new listings compared to previous year include Boston (-17.2%), Pittsburgh (-14.2%), and Washington D.C. (-13.6%).

Across the U.S., the disparity between hot and cold listings remains. Buyers are increasing negotiating power in several markets where new and total inventory have recovered. As said above, homes sold in March in under 13 days. That is slightly slower than in 2021 or 2022, but significantly faster than the pre-pandemic norm.
Buyers should expect well-marketed and competitively priced properties to sell even faster in April and May, as competition heats up. However, some postings are lingering; the median age of all Zillow listings is 43 days. Relatively affordable regions in the Midwest, as well as costly coastal metros like Seattle and Washington, D.C., have exceptionally short periods on market for sold listings, closely matching the buying frenzy at the peak of the pandemic.
A similar result appears when comparing listings with price decreases to those sold above list price. More than one in every five vendors reduced their list price in March, the highest share in almost a decade. Price reductions are most common in Tampa, FL, Phoenix, Jacksonville, FL, San Antonio, and Orlando, FL.
In February, however, nearly 27% of properties sold for more than the list price, up from less than 19% in 2019. Sellers who price their homes right and improve their physical and digital curb appeal should have no trouble “cashing out and moving on.”
Asking Rents Climb Alongside Monthly Mortgage Payments
Rents are now 3.6% higher than last year. In March, asking rentals rose 0.6% month-over-month, reaching $1,983. Before the epidemic, the average growth rate at this time of year was 0.5%.
Rents declined monthly in only one major metropolitan area: Pittsburgh (-0.2%). Cleveland has the poorest monthly increase (0.1%), followed by Salt Lake City (0.1%), Charlotte, NC (0.1%), and Milwaukee (0.2%). Rents are higher than they were a year ago in 48 of the 50 largest metropolitan regions. The largest annual rent increases are in Providence, RI (8.2%), Louisville, KY (6.9%), Cleveland (6.5%), Hartford, CT (6.4%), and Boston (6.1%).
To read the full report, including more data, charts, and methodology, click here.


