


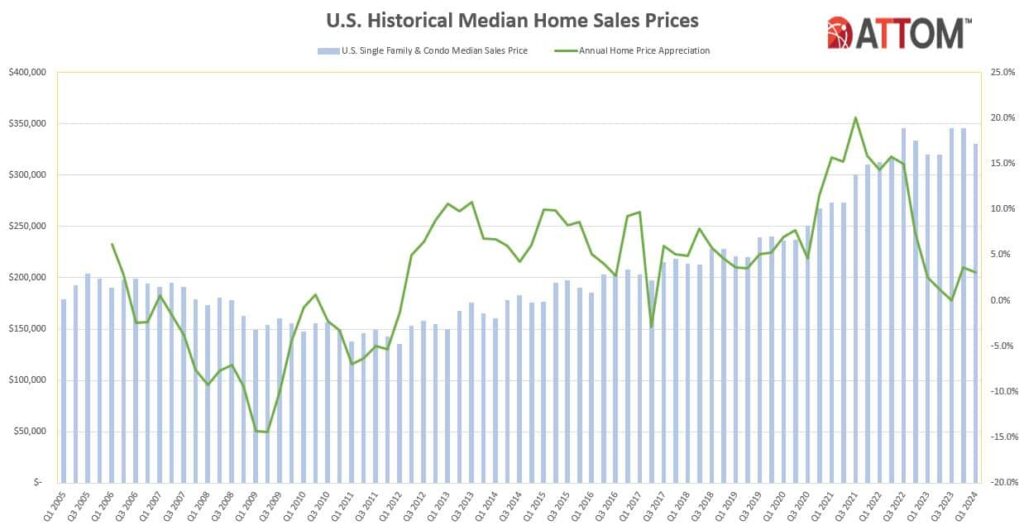
According to ATTOM’s Q1 2024 U.S. Home Sales Report, profit margins on median-priced single-family home and condo sales in the nationwide decreased to 55.3% in Q1–the smallest level recorded in more than two years. The decline in typical profit margins, from 57.1% in Q4 of 2023 and from 56.5% a year ago, came as the median nationwide home price fell quarterly by 4.3%, to $330,000.
ATTOM reports that while prices often fall back during the slower winter home-selling season, the latest decrease marked one of the largest quarterly declines over the past decade. At the same time, investment returns for sellers decreased for the second straight quarter after several increases last year, hitting the low point last seen in mid-2021.
Many factors in play
“The latest price and profit numbers show notably downward trends, which raises new questions about whether the housing-market boom is indeed ebbing, or even ending, after so many years of improvement,” said Rob Barber, CEO for ATTOM. “But due caution is needed in looking at the first-quarter data and what the patterns mean. We saw a similar downward pattern from late 2022 into early 2023, and then the market surged. Plus, profits and profit margins remain high by historical measures. Amid all that, the spring buying season will be a huge barometer for whether the market still has steam in its engine.”
On the upside, the low supply of U.S. homes could push prices higher this spring, as buyers compete for a relatively smaller stock of properties for sale. The recent surge in the stock market also helps by providing more resources for down payments. At the same time, though, mortgage rates have crept back above the 7%-mark for a 30-year fixed-rate mortgage (FRM), as Freddie Mac reports the FRM for the week ending April 25 at 7.17%. A year ago at this time, the 30-year FRM averaged 6.43 percent. Inflation remains a factor as well as inflation nationwide continues to push near the 4% mark.
Those factors are pushing up ownership costs during a time when home affordability already is a stretch for average workers across the country. Recent data from Redfin found that the median monthly housing payment in the U.S. reached an all-time high of $2,747 during the four weeks ending April 7, up 11% year-over-year.
Profit margins decline quarterly and annually in more than half the country
Typical profit margins–the percent difference between median purchase and resale prices–fell from Q4 of 2023 to Q1 of 2024 in 89 (66%) of the 134 metropolitan statistical areas around the U.S. with sufficient data to analyze. They also were down annually in 71, or 53%, of those metros.
That happened as median Q1 home prices declined more, compared to changes that recent sellers were seeing when they originally bought their homes. Those trends, from the point of purchase to the point of resale, translated into lower profit margins in a majority of the country.
The biggest year-over-year decreases in typical profit margins came in the metro areas of:
- Lake Havasu City, Arizona (margin down from 102.4% in Q1 of 2023 to 76.3% in Q1 of 2024)
- Naples, Florida (down from 88.4% to 62.9%)
- Hilo, Hawaii (down from 82.3% to 57.8%)
- Crestview-Fort Walton Beach, Florida (down from 68% to 47.3%)
- Port St. Luce, Florida (down from 92.8% to 72.3%)
The biggest annual profit-margin decreases in metro areas with a population of at least one million in Q1 of 2024 were reported in:
- Honolulu, Hawaii (return down from 57.2% to 41.3%)
- Birmingham, Alabama (down from 36.5% to 21.7%)
- Austin, Texas (down from 49.3% to 37.5%)
- San Antonio, Texas (down from 35% to 25.7%)
- Salt Lake City, Utah (down from 50.7% to 42.2%)
Typical profit margins increased annually in 63 of the 134 metro areas analyzed (47%), with the biggest annual improvements reported in:
- Peoria, Illinois (margin up from 32.6% in Q1 of 2023 to 52.8% in Q1 of 2024)
- Scranton, Pennsylvania (up from 88.1% to 106.5%)
- Oxnard, California (up from 55.1% to 71.2%)
- Rochester, New York (up from 50.4% to 65.2%)
- San Jose, California (up from 85.8% to 100%)
Aside from Rochester and San Jose, the largest annual increases in profit margins among metro areas with a population of at least one million came in San Diego, California (up from 65.3% to 73.8%); Tucson, Arizona (up from 49.8% to 57.4%); and New York, New York (up from 55.7% to 62.7%).
Prices down quarterly in most of the U.S.
Nationwide, the median price of single-family homes and condos declined quarterly to $330,000, down from $345,000 in Q4 of 2023 (a record hit several times over the past two years). The typical home sale decreased quarterly in 112 (84%) of the 134 metro areas around the country with enough data to analyze,
However, latest median prices remained 3.1% higher than the $320,000 price point reported in Q1 of 2023, rising annually in 103 of the metros reviewed (77%).
Metro areas reporting the largest decreases in median home prices from Q4 of 2023 to Q1 of 2024 were:
- Pittsburgh, Pennsylvania (down 11.5%)
- Flint, Michigan (down 10.7%)
- Memphis, Tennessee (down 10.7%)
- Birmingham, Alabama (down 10.2%)
- Montgomery, Alabama (down 9.7%)
Aside from Pittsburgh, Memphis and Birmingham, the largest quarterly median-price decreases in metro areas with a population of at least one million were found in St. Louis, Missouri (down 8.1%) and Indianapolis, Indiana (down 7.4%).
Metro areas with a population of at least one million where the median home price remained up most from Q1 of last year to the same period this year were:
- Rochester, New York (up 13.2%)
- Hartford, Connecticut (up 12.2%)
- Cincinnati, Ohio (up 8.9%)
- Providence, Rhode Island (up 8.8%)
- San Jose, California (up 8.5%)
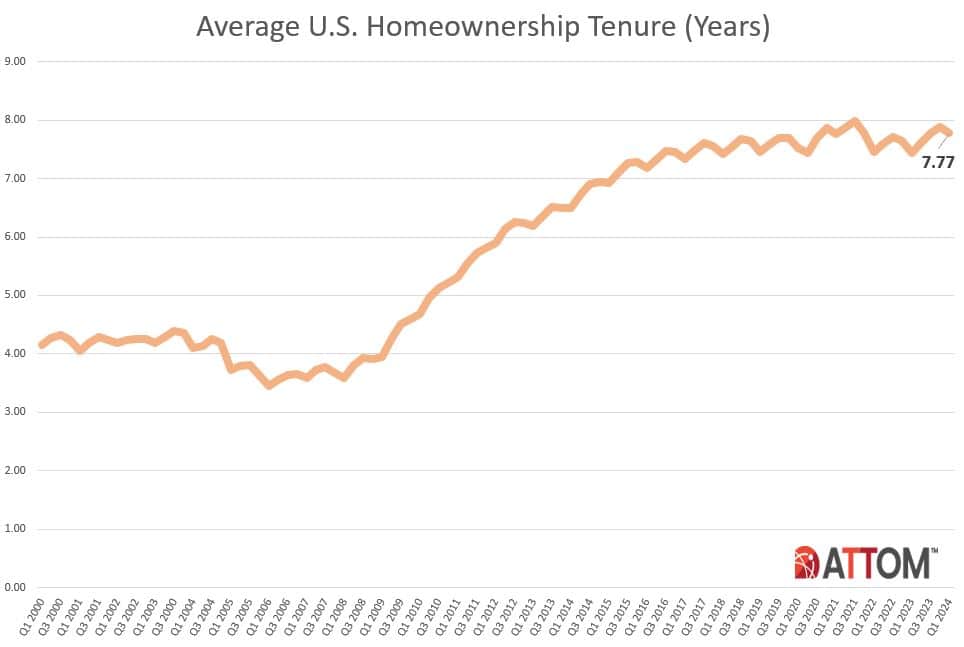
Homeownership tenure down slightly
Homeowners who sold in Q1 of 2024 had owned their homes an average of 7.77 years, down from 7.88 years reported in Q4 of 2023, but up from 7.44 years in Q1 of 2023.
Average tenure was up from Q1 of 2023 to the same period this year in 73 percent of metro areas with sufficient data. The largest annual increases were reported in:
- Redding, California (tenure up 23%)
- Santa Cruz, California (up 17%)
- Yakima, Washington (up 13%)
- Oxnard, California (up 13%)
- Jacksonville, Florida (also up 13%)
The longest 40 average tenures among sellers in Q1 of 2024 were in the Northeast or West regions of the U.S., led by:
- Barnstable, Massachusetts (13.2 years)
- New Haven, Connecticut (13.06 years)
- Bridgeport, Connecticut (12.99 years)
- Santa Cruz, California (12.94 years)
- Oxnard, California (12.36 years)
The smallest average tenures among Q1 sellers were reported in:
- Provo, Utah (6.33 years)
- Panama City, Florida (6.57 years)
- Austin, Texas (6.59 years)
- San Antonio, Texas (6.6 years)
- Chattanooga, TN (6.61 years)
Contributing to extended tenure times is what is known as the “lock-in effect” where homeowners are “locked-in” to their current residence strictly by the rising mortgage rate environment. A new study from Zillow found that older homeowners and those in less expensive metros are the least likely to be discouraged from moving by today’s higher mortgage rates. Zillow data found that 10.8 million current homeowners U.S. (13%) should be immune to the effects of high interest rates. Markets with more homeowners free from rate lock have seen more homes listed for sale, giving buyers more choices during a prolonged shortage of housing inventory.
“The so-called mortgage rate lock-in effect has seriously curtailed both home sales and inventory over the past two years. Homeowners are more free to sell in less expensive areas—bringing more resale inventory into the market and facilitating sales,” said Orphe Divounguy, Zillow Senior Economist. “Massive appreciation has left homeowners with record levels of equity, and many are financially able to move on, even given today’s higher rates.”
Click here for more on ATTOM’s Q1 Home Sales Report.


