ATTOM has released its Q3 2024 U.S. Home Sales Report, which shows that homeowners earned a 55.6% profit margin on typical single-family home and condo sales. That figure was down by small amounts both quarterly and annually, dipping by one percentage point from Q2 of 2024 and two points from Q3 of last year.
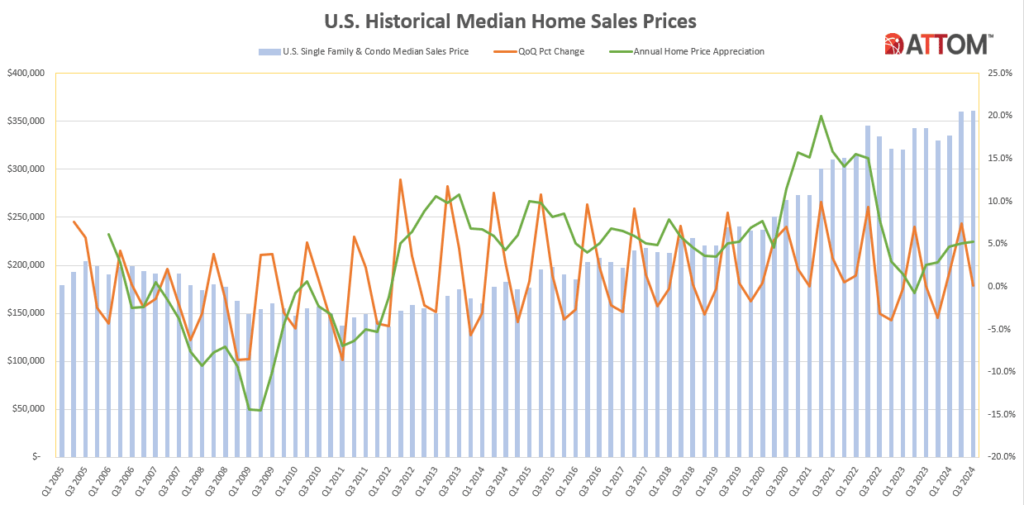
The nationwide investment return ticked downward as home-price spikes that had buoyed the housing market during the spring of this year flattened out, leaving the U.S. median home value virtually unchanged at approximately $360,000. While home-seller profits remain historically high, the national margin has declined almost every quarter from a 64% peak hit in 2022. The leveling of prices during Q3 also led to typical raw profits for sellers staying about the same, near an all-time high of just under $130,000.
“The latest price and profit numbers provided another round of generally good news for homeowners, tempered by a bit of a downside,” said Rob Barber, CEO for ATTOM. “Home values remained at or near record levels around large swaths of the country, keeping seller profits far above historical levels. At the same time, though, the housing market settled down after a big second quarter, which extended a slow fallback in profit margins that started last year. If history is a good guide, the fourth quarter is likely to bring more of the same as the peak buying season ends.”
He added that “this is far from a warning sign that the long market boom is ending. But there certainly are forces that could cut either way, especially as affordability remains a challenge for so many potential buyers.”

A Closer Look at Profit Margins
Typical profit margins–the percent difference between median purchase and resale prices–remained the same or decreased from Q2 of 2024 to Q3 of 2024 in 79 (50.6%) of the 156 metropolitan statistical areas around the U.S. They were down annually in 112, or 71.8%, of those metros, and down in about the same portion since Q2 of 2022, when the nationwide return on median-priced home sales peaked at 64.3%. Profit margins have softened over the past year throughout all price segments of the market, from metro areas where home values mostly sit below $250,000 to those where they top $450,000. But the low end of the market has fared a bit better. Typical margins decreased annually in approximately 60% of the least expensive metro areas compared to about 75% elsewhere.
The biggest year-over-year decreases in typical profit margins during Q3 of 2024 came in the metro areas of San Francisco where the margin was down from 84.9% in Q3 of 2023 to 61.4% in Q3 of 2024. Following San Francisco was:
- Punta Gorda, Florida (down from 94.1% in Q3 of 2023 to 74.4% in Q3 of 2024)
- Scranton, Pennsylvania (down from 88.2% to 69.6%)
- South Bend, Indiana (down from 77.3% to 59.2%)
- Hilo, Hawaii (down from 86.5% to 70.5%)
Aside from San Francisco, the biggest annual profit-margin decreases in metro areas with a population of at least one million in Q3 of 2024 were reported in:
- Austin, Texas (typical return down from 44.3% to 33.3%)
- Honolulu, Hawaii (down from 53.9% to 43.3%)
- Riverside, California (down from 78.6% to 69%)
- Birmingham, Alabama (down from 52.1% to 42.7%)
The biggest annual improvements in returns on investment came in Trenton, New Jersey where the rose from 65.5% in Q3 of 2023 to 87.4% in Q3 of 2024, followed by:
- Albany, New York (up from 31.8% to 51.6%)
- Rockford, Illinois (up from 54.5% to 70.2%)
- Rochester, New York (up from 66.7% to 81.2%)
- Evansville, Indiana (up from 47.2% to 61.7%)
And despite the downward trend, returns-on-investment (ROI) for median-priced home sales during Q3 of 2024 still surpassed 50% in 107 of the metro areas analyzed (68.6% to be exact)—down from three quarters of those areas in Q3 of last year, but far above the level of 13% reported five years ago. The leaders among areas with a population of at least one million in Q3 of this year were:
- San Jose, California (typical return of 109.8%)
- Seattle, Washington (90.3%)
- Providence, Rhode Island (84.6%)
- Miami, Florida (83.9%)
- Grand Rapids, Michigan (81.9%)
The lowest among areas with a population of at least one million were in:
- New Orleans, Louisiana (24.8%)
- San Antonio, Texas (25.1%)
- Austin, Texas (33.3%)
- Houston, Texas (37.3%)
- Dallas, Texas (37.4%)
Profits Remain Near Record Levels
The raw profit on median-priced home sales nationwide, measured in dollars, slipped 0.9% during the months running from July through September of this year, to $128,700. But it was still up 2.7% from Q3 of 2023, and remained near the record of $135,000 hit in 2022. Typical raw profits were flat or down quarterly in 74, or 47.4%, of the markets analyzed. Despite the nationwide year-over-year gain, raw profits were the same or down annually in 82, or 52.6% of those metro areas.
The biggest year-over-year increases in raw profits on typical sales among metro areas with a population of at least one million were reported in:
- Rochester, New York (up 24.4%)
- Cleveland, Ohio (up 23.5%)
- Providence, Rhode Island (up 18.9%)
- Chicago, Illinois (up 18.8%)
- Cincinnati, Ohio (up 15%)
Raw profits on median-priced sales exceeded $100,000 during Q3 in 67.3% of the metro areas analyzed, with 19 of the top 20 along the east or west coasts. They were led by:
- San Jose, California (raw profit of $785,000)
- San Francisco, California ($380,600)
- San Diego, California ($377,000)
- Los Angeles, California ($376,000)
- Barnstable, Massachusetts ($361,968)
The 25 lowest raw profits were all reported in the Midwest or South, found in:
- Beaumont, Texas ($15,481)
- Lubbock, Texas ($29,740)
- Alabama ($35,590)
- Macon, Georgia ($37,692)
- McAllen, Texas ($40.312)
Click here for more on ATTOM’s home sale profit statistics for Q3 of 2024.


