According to the most recent quarterly report from the National Association of Realtors (NAR), home prices increased in nearly 90% of metro markets (201 out of 226, or 89%) in Q4 of 2024, while the 30-year fixed mortgage rate varied between 6.12% and 6.85%. Compared to 7% in Q3, some 14% of the 226 metro regions under observation had double-digit price increases within the same time frame.
The typical single-family existing-home price nationwide increased 4.8% to $410,100 from a year ago. The national median price rose 3.2% year-over-year (YoY) in the most recent quarter. The median home price increased by 49.9% over the last five years, from 2019 to 2024.
With a 2.1% YoY price increase, the South had the highest percentage of single-family existing-home sales (45.1%) among the major U.S. regions in Q4. Additionally, prices rose 4.0% in the West, 8.0% in the Midwest, and 10.6% in the Northeast.
“Record-high home prices and the accompanying housing wealth gains are definitely good news for property owners,” said Lawrence Yun, Chief Economist at NAR. “However, renters who are looking to transition into homeownership face significant hurdles.”

Metro-Level Data: Price Growth & Affordability Hurdles
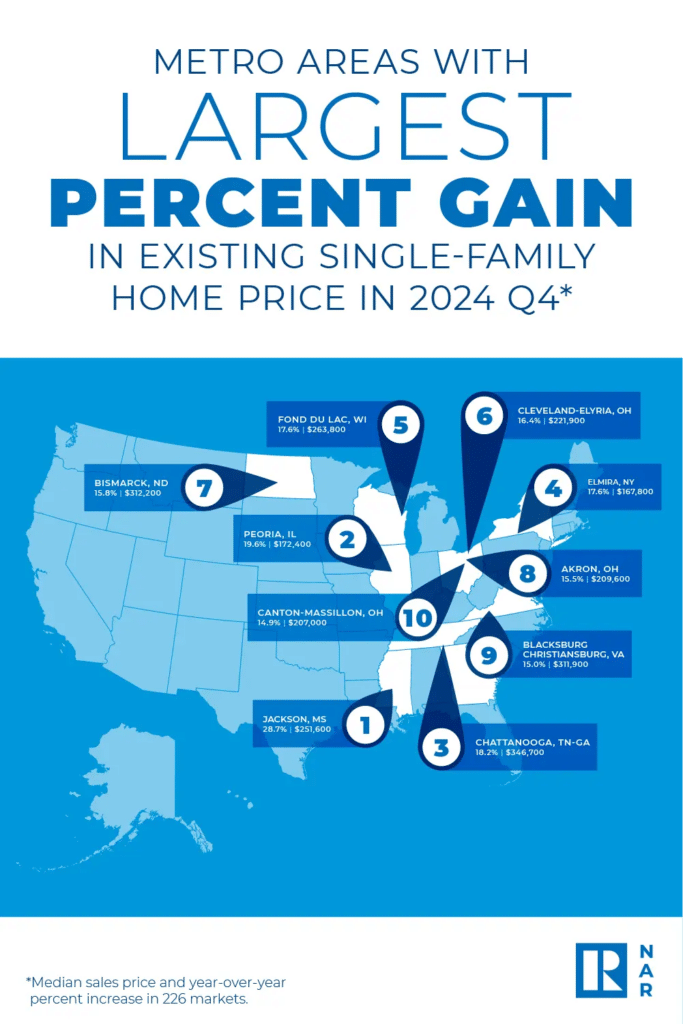
The top 10 metro areas with the largest YoY median price increases, which can be influenced by the types of homes sold during the quarter, all experienced gains of at least 14.9%—with six of the markets found in the Midwest.
Overall, the markets who saw the largest price increases were:
- Jackson, MS (28.7%)
- Peoria, IL (19.6%)
- Chattanooga, TN-GA (18.2%)
- Elmira, NY (17.6%);
- Fond du Lac, WI (17.6%);
- Cleveland-Elyria, Ohio (16.4%);
- Bismarck, ND (15.8%);
- Akron, Ohio (15.5%);
- Blacksburg-Christiansburg, VA (15.0%)
- Canton-Massillon, Ohio (14.9%)

While it may come as no surprise, the “Golden State” of California was home to eight of the 10 most expensive markets in the US.
The costliest markets were found in:
- San Jose-Sunnyvale-Santa Clara, CA ($1,920,000; 9.7%)
- Anaheim-Santa Ana-Irvine, CA ($1,360,000; 4.7%)
- San Francisco-Oakland-Hayward, CA ($1,315,600; 5.2%)
- Urban Honolulu, Hawaii ($1,103,100; 3.2%)
- San Diego-Carlsbad, CA ($985,000; 5.7%)
- Salinas, CA ($943,900; -5.0%)
- Los Angeles-Long Beach-Glendale, CA ($939,700; 6.3%)
- San Luis Obispo-Paso Robles, CA ($927,200; 1.7%)
- Oxnard-Thousand Oaks-Ventura, CA ($920,000; 0.3%)
- Boulder, CO ($840,700; -1.0%)

In Q4, housing prices declined in nearly 11% of U.S. markets (24 of 226), compared to 13% in Q3.
Housing Affordability Lags as Income Requirements Heighten
In Q4, housing prices declined in nearly 11% of U.S. markets (24 of 226), compared to 13% in Q3. The fourth quarter saw a little improvement in housing affordability. A typical existing single-family home with a 20% down payment had a monthly mortgage payment of $2,124, which was 0.8% lower than the third quarter’s payment of $2,141 and 1.7% lower than a year ago, or $37. Mortgage payments accounted for 24.8% of families’ income on average, compared to 25.2% in the previous quarter and 26.5% a year before.
The affordability situation for first-time buyers was marginally better than it was in the previous quarter. The monthly mortgage payment decreased to $2,083 from the previous quarter ($2,101) for a typical starter home worth $348,600 with a 10% down payment loan. That was $35 less than a year earlier ($2,118), or 1.7% less. Mortgage payments for first-time buyers typically accounted for 37.4% of their family income, a decrease from the previous quarter’s 38.1%.
In 43.8% of markets, a household had to earn at least $100,000 in qualifying income to qualify for a 10% down payment mortgage, compared to 42.5% in the prior quarter. In 2.2% of markets, however, a family needed a qualifying income of less than $50,000 to afford a home, which was the same as the previous quarter.
“While recognizing many workers may not have the option to relocate, those who can or are willing to move may find more affordable conditions, especially given the wide variance in home prices nationwide,” Yun said.
The next quarterly Metropolitan Median Area Prices and Affordability and Housing Affordability Index release will be Thursday, May 8, 2025, at 10 a.m. EST.
To read the full release, including more data and methodology, click here.


