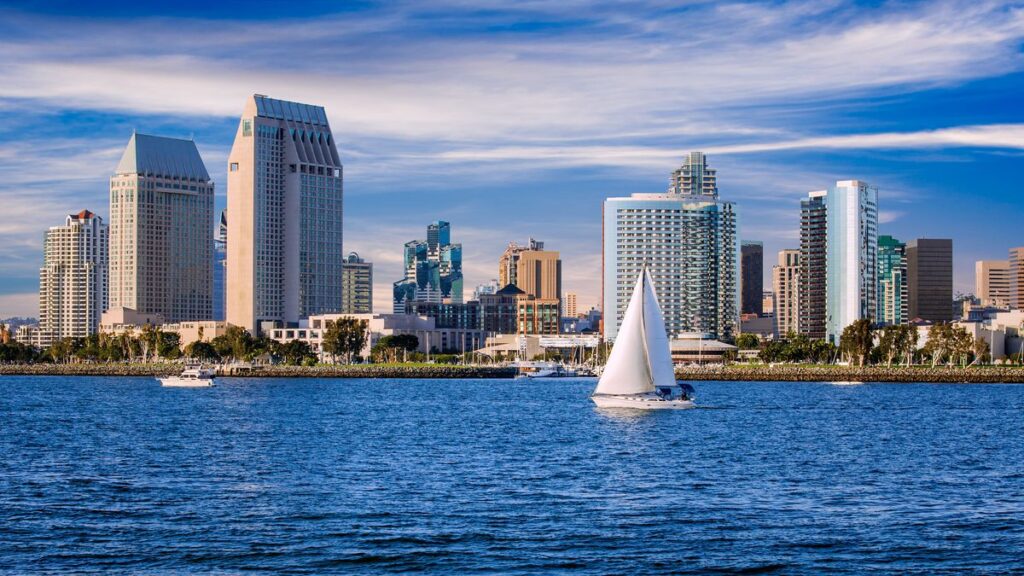
New Redfin data revealed that in February, the percentage of properties sold for more than their initial list price increased in about eight of the 50 most populated U.S. metro regions, half of which are in the Bay Area or New York.
The famed city of San Francisco saw the largest increase among the top 50 metro areas, with an estimated 57.2% of sold properties selling for more than their original list price, up 7.5 percentage points from the previous year.
Pent-up demand caused the housing market to flare up in February, but as buyers wait for more inventory, it has cooled off in March, according to Josh Felder, a Redfin Premier real estate agent in the Bay Area. Compared to before the outbreak, the market still seems less active.
“The Bay Area has an unending population of people with enormous swaths of money,” said Felder. “A decade or so ago, we all thought the growth in home prices was unsustainable, but they just keep going up and up. That’s partly because there aren’t enough homes for sale, and partly because tech continues to boom despite ups and downs in the stock market and geopolitical uncertainty.”
The great San Fransisco metro is followed by: Nassau County, NY (+4.4 ppts), San Jose, CA (+3.5 ppts), Milwaukee (+2.7 ppts), San Antonio (+2.4 ppts), New York (+2.2 ppts), Portland, OR (+1.4 ppts) and Philadelphia (+0.8 ppts).
Additional Findings:
- In February, an estimated 20.5% of properties nationwide sold for more than their initial list price, compared to 22.8% in the same month last year.
- Compared to 60.9% a year ago, nearly two-thirds (64.2%) sold for less than their initial list price.
- Approximately 15.4% of the shares sold for their initial list price, which is the lowest February share since 2019. This is down from 16.3% a year earlier.
As many Americans migrated out of large cities during the pandemic, the demand for homes in the Bay Area and New York fell significantly, although it has been increasing recently.
“I submitted an offer on a house in a really desirable San Jose neighborhood recently and there were 22 offers. It ended up going for around 10% over the asking price, which is commonplace,” Felder said. “But back in 2017 or 2018, it was common for homes in desirable neighborhoods to sell for 15% or more over asking, indicating that today’s market is actually somewhat restrained.”
In particular, the Bay Area’s inventory has begun to improve; in February, active listings of homes for sale in San Francisco increased 5.8% year-over-year, while in San Jose, CA, and Oakland, CA, they increased 27% and 38.7%, respectively.

Metro-Level Summary: February 2025
(Top 10 most populous metros w/ the highest share of homes sold above list price)
| U.S. metro area | Median original list price of homes sold | Y/Y change in median original list price of homes sold | Share of homes sold above original list price | Y/Y change in share of homes sold above original list price | Share of homes sold below original list price | Y/Y change in share of homes sold below original list price | Share of homes sold at original list price | Y/Y change in share of homes sold at original list price |
|---|---|---|---|---|---|---|---|---|
| San Jose, CA | $1,488,000 | 10.3% | 67.1% | 3.5 ppts | 25.0% | -3.5 ppts | 8.0% | -0.1 ppts |
| Oakland, CA | $899,000 | 2.7% | 57.7% | -3.2 ppts | 34.6% | 6.4 ppts | 7.7% | -3.2 ppts |
| San Francisco | $1,398,000 | 0.2% | 57.2% | 7.5 ppts | 31.9% | -4.2 ppts | 10.9% | -3.3 ppts |
| Newark, NJ | $549,950 | 6.8% | 53.5% | -0.8 ppts | 36.9% | 1.8 ppts | 9.6% | -1.0 ppts |
| Nassau County, NY | $699,999 | 9.4% | 47.1% | 4.4 ppts | 46.1% | -4.3 ppts | 6.9% | -0.1 ppts |
| Boston | $699,900 | 4.6% | 43.1% | -1.8 ppts | 46.7% | 0.4 ppts | 10.2% | 1.4 ppts |
| Providence, RI | $479,900 | 6.9% | 38.1% | -4.6 ppts | 46.1% | 1.5 ppts | 15.8% | 3.1 ppts |
| Milwaukee | $329,900 | 17.9% | 38.1% | 2.7 ppts | 49.5% | -2.2 ppts | 12.4% | -0.5 ppts |
| New Brunswick, NJ | $529,900 | 8.2% | 37.9% | -3.5 ppts | 51.2% | 3.8 ppts | 10.8% | -0.3 ppts |
| Washington, D.C. | $559,000 | 3.5% | 37.8% | -2.0 ppts | 42.7% | 1.4 ppts | 19.5% | 0.6 ppts |
Which Metros Are Seeing the Biggest ‘Buyer Markets’?
Many home sellers overprice their properties and wind up receiving less money than they had anticipated. Today, that is becoming more and more true as 2025 seems to be a buyer’s market because of high mortgage rates and growing inventory.
For a short time during the pandemic homebuying craze, the percentage of homes selling above list price soared and was almost 40% of all properties sold below list price. However, their numbers have now returned to their pre-pandemic levels. Today, if sellers want to find a buyer quickly, some experts suggest they price their homes reasonably.
“America’s Finest City” saw the highest increase among the top 50 metro areas: San Diego, where 51.2% of properties sold in February for less than the seller’s asking price—an increase of 8.9 percentage points year-over-year.
The top five metros that saw the biggest jump in homes selling above list price:
- San Deigo (+8.9 ppts)
- Anaheim, CA (+8.7 ppts)
- Charlotte, NC (+7.3 ppts)
- Atlanta (+7.3 ppts)
- Sacramento, CA (+6.8 ppts)

The increase may be due in part to an increase in inventory, as active listings of homes for sale increased 23.9% year-over-year on average in those five metro areas. For the five metro areas with the largest increases in properties selling above asking price, it is almost three times the average gain of 8.4%. When they have more options, homebuyers are more inclined to try to negotiate a cheaper price.
“When sellers have a polished home that’s priced appropriately, it will sell really, really quickly,” said Charles Wheeler, a Redfin Premier real estate agent in San Diego. “It’s the sellers that really want to push the value that get into trouble. Even overpricing by $20,000 can scare buyers off and cause a home to sit on the market.”
Due to the fact that many purchasers in the Bay Area underprice properties to incite bidding wars, the region almost always has the most percentage of homes selling above list price. To show that the Bay Area not only has the most percentage of homes selling above asking price, but is also witnessing this trend grow at the fastest rate in the world, this analysis takes the lead in year-over-year changes.
Of the metros Redfin examined, West Palm Beach, FL, had the largest percentage of properties that sold in February below their initial list price, at 88.2%. Miami (83.7%) and Fort Lauderdale, FL (85.7%), are the next two Florida metro areas. Two popular Texas metro areas, Austin (80.2%) and San Antonio (81.2%), complete the top five.
Due in part to a less restricted supply of available properties than in other urban areas, Florida and Texas probably top the list. Buyers now have more negotiating power because they have been developing more homes than other states and stale inventory has been stacking up. Some buyers are hesitant because of Florida’s increasing insurance costs, soaring HOA dues, and worsening natural disasters.
The greatest percentage of all the metro areas Redfin examined was Seattle, WA, where 26.7% of properties sold in February for the same amount they were listed for. Next in line were Columbus, Ohio (18.4%), Washington, D.C. (19.5%), Nashville (24%), and Virginia Beach, VA (25.7%).
To read more, click here.


