


With economic uncertainty and the imposition of tariffs digging deeper into the pockets of prospective homebuyers and causing additional hurdles, even home flippers and cash-rich investors felt the pinch of the market in the first quarter of 2025.
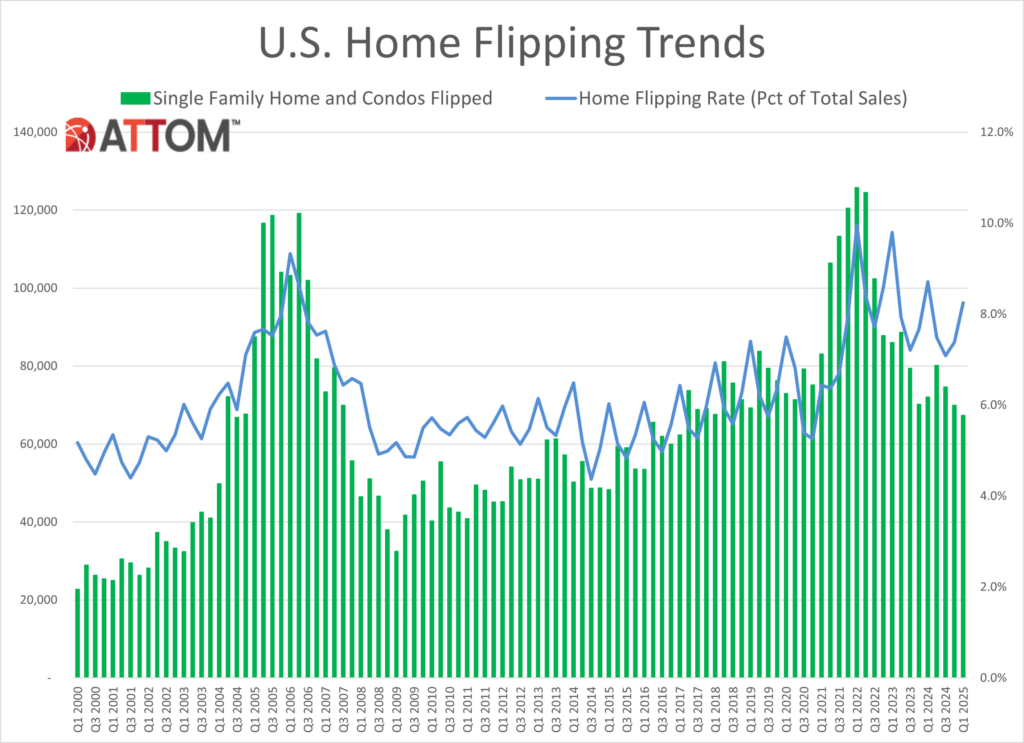
According to ATTOM’s Q1 2025 U.S. Home Flipping Report, 67,394 single-family homes and condominiums were flipped in the first quarter of 2025, accounting for a 8.3% of all home sales from January through March (Q1 of 2025). The share of flipped properties, as a percentage of all sales, rose to 8.3% from 7.4% the previous quarter, but it was down slightly compared to the same time last year, when flips accounted for 8.7% of all sales.
With the median home sales price in the U.S. in Q1 at $416,900, and the average home sales price sitting at approximately $503,800, first-time buyers and flippers alike were simply priced out of the market, and may be forced to sit on the sidelines even longer should market forces continue.
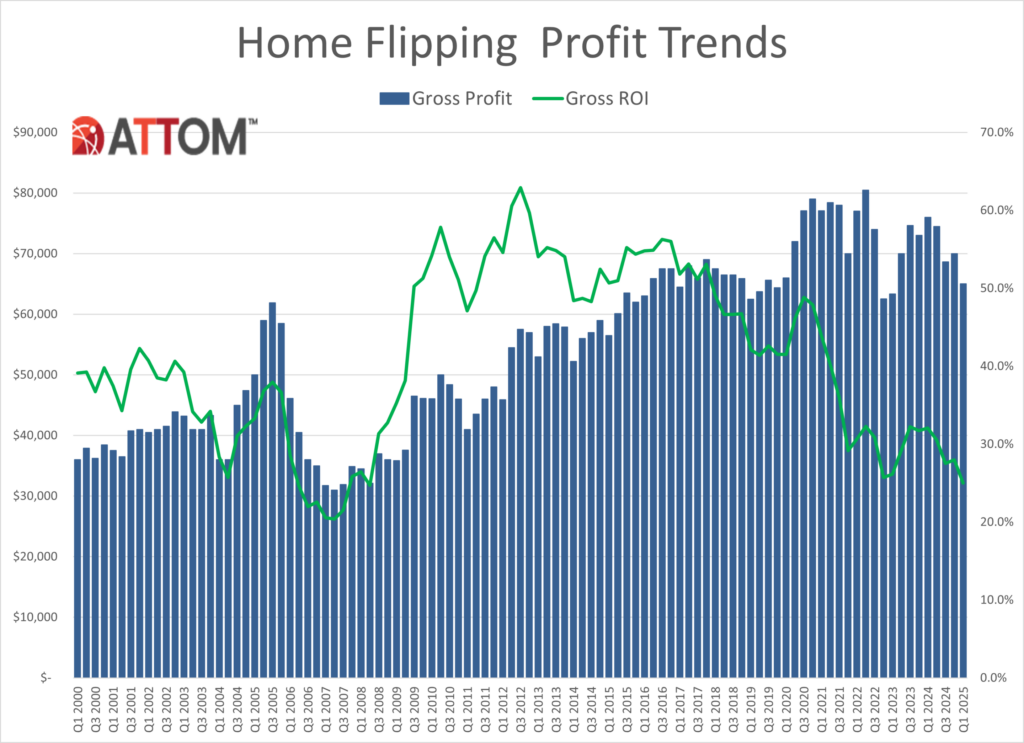
As the buying slowdown appears to be impacting home flippers, of the 67,394 homes and condominiums flipped nationwide during Q1 marked the lowest number of properties flipped in a quarter since 2018. Returns have also been falling, with the typical flipped home netting a 25% return-on-investment (before expenses) in Q1 2025, down from 28% in the previous quarter, and continued a gradual decline from the recent high of 48.8% in the fall of 2020. Gross profits on a typical flipped home (difference between the median purchase and median resale price for home flips), were down approximately $5,000 in Q1, from $65,000 to $70,000 in the fourth quarter of 2024. The typical investor paid $260,000 for a home they flipped in Q1 2025, and sold the property for $325,000.
“The competitive home market means high prices, which is good for short-term investors on the selling end,” said Rob Barber, CEO at ATTOM. “But that dynamic is also making it harder to find underpriced homes to buy up and it’s ultimately squeezing profit margins for the industry.”
Factors to Stunt Profitability
In April, President Trump announced the imposition of a 10% baseline tariff on all imports to the U.S. In the home flipping space, costs to investors will rise, as the price of imported construction and remodeling materials will be initially absorbed by the importer and passed on to the end consumer. Any tariff on international building materials will inevitably increase the cost of housing, with consumers absorbing 100% of those costs.
The National Association of Home Builders (NAHB) notes that lumber remains a primary concern under the new tariff rules, with countervailing and antidumping duties expected to more than double this fall.
“Any increase in pricing of any type of construction material causes our consumers to pay more,” Dan Mitchell, Owner of Eagle CDI, told CNN. “So, we are concerned about the rising prices, we are concerned about the commodities that we’re using in new construction, and obviously, lumber, cement and other commodities such as that driving up prices for the consumers is going to have an impact on our builders being able to provide homes.”
According to the April NAHB/Wells Fargo Housing Market Index (HMI), on average, suppliers increased their prices by 6.3% in response to news of the tariffs. Builders estimate an average cost increase of $10,900 per home due to these tariff actions.
“It’s tricky to balance at times when the market looks like it could take a downturn,” Barber added. “Investors don’t want to buy a property when prices are high and then see them drop before they’re ready to sell.”
Targeting Bargain Prices
Investors and flippers have shifted their strategy and have become more selective in the homes they are acquiring. ATTOM found that metro areas where the typical flipped home cost investors less than $225,000 to purchase tended to give the best returns-on-investment (ROI). The median profit margin in those lower-end metro markets was 46.4%.
In markets where the median purchase price before a flip was between $225,000 and $400,000, the median ROI was 22%, while in areas where homes initially cost flippers more than $400,000, the median ROI dropped to 19%.
Nationwide, 62.2% of all homes flipped during Q1 of 2025 were purchased with all cash, down slightly from 63.4% the previous quarter, but pretty much the same as the same time last year. Flippers purchased the other 37.8% of homes through financing.
The metro areas where flippers purchased the highest share of homes entirely with cash were found in:
- Rockford, Illinois (81.6% of flipped homes)
- Toledo, Ohio (81.2%)
- Buffalo, New York (81.2%)
- Cape Coral, Florida (81.1%)
- Naples, Florida (81.1%)
Metros Reporting Flipping Declines
Home flips, as a share of total sales, rose quarter-over-quarter in 76.3% (132) of the 173 metropolitan statistical areas with sufficient data to analyze. However, the share was down compared to the same time last year in two-thirds (115) of the metro areas. Metro areas were included if they had a population of 200,000 or more and at least 50 home flips in Q1 of 2025. Among the metro areas analyzed, home flippers accounted for the biggest share of sales in:
- Macon, Georgia (flips compromised 21% of all home sales)
- Warner-Robins, Georgia (20.6%)
- Atlanta, Georgia (15.9%)
- Memphis, Tennessee (14.7%)
- Akron, Ohio (13.3%)
Besides Atlanta and Memphis, the metro areas with populations over one million that had the highest proportion of flips were:
- Birmingham, Alabama (12.8%)
- Kansas City, Missouri (11.6%)
- Salt Lake City, Utah (11.1%)
Of those biggest metro areas, the smallest proportion of flips were reported in:
- Honolulu, Hawaii (4.7%)
- New Orleans, Louisiana (4.9%)
- Seattle, Washington (5.5%)
- Pittsburgh, Pennsylvania (5.9%)
- Portland, Oregon (6.1%)
Home Flipping Returns Drop Annually
ATTOM reports that homes flipped in Q1 of 2025 sold for a nationwide median of $325,000, netting a 25% ROI, and a $65,000 gross profit over the $250,000 median purchase price. Profit margins were down quarter-over-quarter in 45.7% (79) of the 173 metro areas in ATTOM’s analysis, and down annually in 63% (109) of the markets.
The metro areas reporting the biggest quarterly declines in flipping profit margins were:
- Spartanburg, South Carolina (return on investment down from 160.2% in Q4 2024 to 31.3% in Q1 2025)
- Ocala, Florida (down from 125% to 50.6%)
- Chattanooga, Tennessee (down from 125.6% to 81.3%)
- Lynchburg, Virginia (down from 69.2% to 31%)
- Johnson City, Tennessee (down from 82.1% to 44.5%)
Among metro areas with populations over one million, the biggest quarterly profit margin drop offs were reported in:
- St. Louis, Missouri (ROI down from 49.3% in Q4 2024 to 27.3% in Q1 2025)
- Fresno, California (down from 51.3% to 37.8%)
- Pittsburgh, Pennsylvania (down from 108.7% to 100.4%)
- New York City, New York (down from 44.2% to 36.1%)
- Chicago, Illinois (down from 52.6% to 44.8%)
Just 45 of the 173 metro areas analyzed posted typical flipping profit margins (before expenses) in excess of 50%, with the most lucrative markets located in the Midwest and Northeast.
The areas reporting the largest ROI in Q1 of 2025 were:
- Buffalo, New York (102.1% ROI)
- Pittsburgh, Pennsylvania (100.4%)
- Scranton, Pennsylvania (89.9%)
- Peoria, Illinois (89.1%)
- Rockford, Illinois (87.7%)
Aside from Buffalo and Pittsburgh, the metro areas with populations over one million that had the largest flipping profit margins were reported in:
- New Orleans, Louisiana (76.5% ROI)
- Memphis, Tennessee (69.7%)
- Philadelphia, Pennsylvania (69.6%)
The largest metro areas reporting the smallest profit margins were:
- Austin, Texas (1% ROI)
- Dallas, Texas (3.7%)
- Houston, Texas (5%)
- Salt Lake City, Utah (6.5%)
- San Antonio, Texas (6.9%)
Click here for more on ATTOM’s Q1 Home Flipping Report.


