



In order to investigate how middle-class access to homeownership has evolved between the late 1960s and the early 2020s, AD Mortgage carried out a statewide survey. We sought to determine how the link between household income and housing prices has changed by comparing important measures during the second half of each decade, including the post-COVID period of 2020–2024.
This paper emphasizes how rising property prices and increased upfront fees have made it more difficult for middle-class households to afford homes, even though the national homeownership rate has remained steady. Expert research provides insightful information about how the dynamics of homeownership in the U.S. are changing and how affordability is becoming a bigger problem for modern homebuyers.
“What it means to be middle-class in housing has changed since the 1970s, presenting regular folk with new challenges,” said Max Slyusarchuk, CEO of AD Mortgage. “Our goal is to ensure these financial challenges don’t stand in the way by providing support, guidance, and solutions that help households achieve their aspirations of homeownership.”
The report examines the following key indicators related to housing access:
- Median home price
- Median household income
- Housing supply
- Vacancy and occupancy rates
- Ownership and renting rates
- Population and housing units per capita
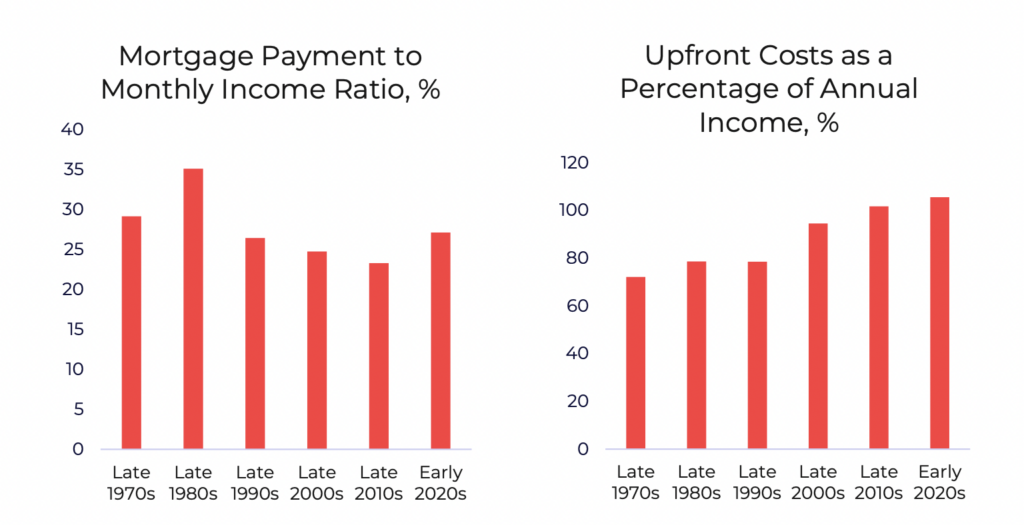
Note: Standardized mortgage model based on a 30-year fixed-rate mortgage with a 20% down payment to compare financing conditions. This model is applied to periods from the mid-1970s onward, including the 2020–2025 post-COVID period, reflecting the availability of long-term U.S. mortgage rate data starting in 1971.
Examining Middle-Class Access to Housing for Americans
The increasing gap between household income and housing costs is one of the most obvious changes in the data. A summary of these include:
- In the late 1960s, the median household income was $7,518 and the median home price was $22,955, resulting in a price-to-income ratio of 3.05.
- In the early 2020s, the median family income increased to $75,445 while the median home price increased to $397,920, resulting in a price-to-income ratio of 5.27.
Although household incomes increased over time, the sharp increase in property prices outpaced their growth. In the late 1960s, the average home cost little more than three times the annual household income; by the early 2020s, that amount had increased to more than five times.
Homeownership in the U.S. seems to be quite constant at first glance:
- Late 1960s: 64%
- Late 1970s: 65%
- Late 1980s: 64%
- Late 1990s: 66%
- Late 2000s: 68%
- Late 2010s: 64%
- Early 2020s: 66%
Stated differently, constant ownership rates do not always signify unaltered access. The path to homeownership is now more reliant on income, loan terms, and available resources since middle-class households face tougher financial challenges than in previous decades.
The rise in housing units per capita, or the availability of more residences in relation to the population, is one beneficial development.
- Late 1960s: 0.33 housing units per capita
- Early 2020s: 0.43 housing units per capita
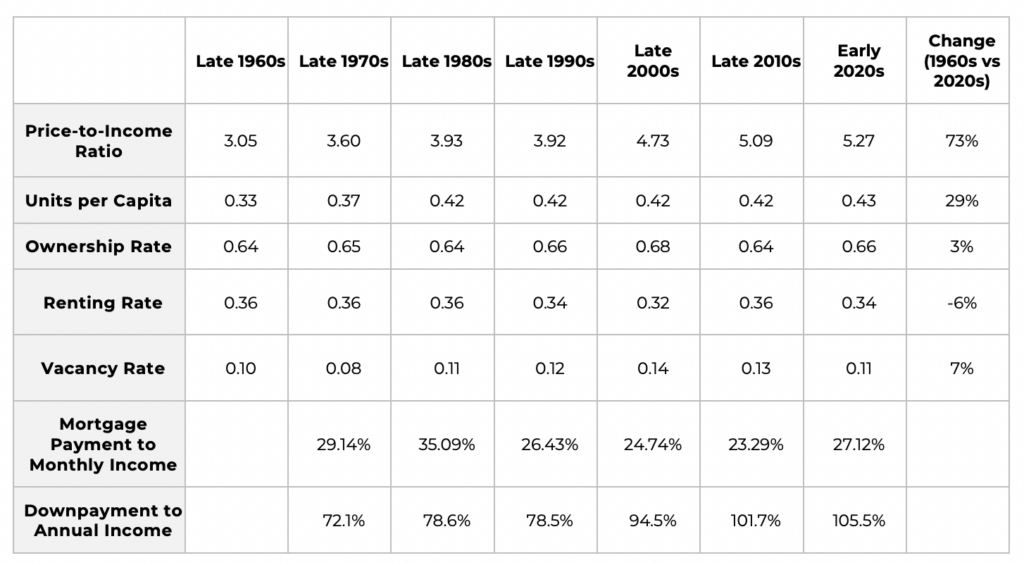
The middle class now has more possibilities for homeownership, as seen by the 29% increase in housing availability between the late 1960s and the early 2020s. The financial obstacles to entry have increased despite this improvement in supply, mostly as a result of growing housing prices and higher down payments.
The initial costs of purchasing a home have increased dramatically, even though monthly mortgage payments as a percentage of household income have declined. This creates an intriguing paradox: while lenders have made monthly payments easier to handle, it is now much more difficult to make the needed down payment in relation to income. We can conclude that the number of homeowners would have decreased if lenders had not adjusted to the rising cost of housing.
A closer look:
- Late 1970s: Mortgage rates were higher (9.5%), and monthly payments accounted
for 29.14% of median household’s monthly income. - Late 1980s: Monthly payments peaked at 35.09% of median household income.
- Late 2010s: Monthly payments were at their lowest, 23.29% of median household
income. - Early 2020s: Mortgage rates dropped to 4.98%, and monthly payments
represented 27.12% of median household’s monthly income.
The reduction in monthly payments appears to be a benefit at first glance. But when we consider the down payment:
- Late 1970s: The typical down payment was about 72.1% of annual income.
- Early 2020s: The down payment rose to 105.5% of annual income.
Despite reduced mortgage rates, homeownership is now more dependent on available resources since the upfront investment required to enter the housing market has climbed by 46%, even while monthly payments are now a smaller burden compared to income (down approximately 7% since the 1970s).
Further, many middle-class families found it easier to become homeowners in the 1960s.
A regular middle-class salary was typically sufficient to buy a house, and owning a home was a common goal strongly linked to having a reliable source of income.
But by the 2020s, there was less of a direct correlation. Even people with middle-class incomes can no longer afford to become homes. Rather, becoming a homeowner now depends on a number of other circumstances, including leverage, available funds, and growing home prices. Overall, this development illustrates how the path to homeownership has grown more complicated and indicates a shift in the link between income and homeownership.
Note: The survey is based on historical data and general market trends and is not intended to serve as personal financial advice or predict future housing market conditions. The insights provided are for informational purposes only and reflect the evolution of housing affordability over time. Individual financial circumstances and market conditions can vary widely, and we recommend consulting with a financial advisor or housing professional for specific guidance.