


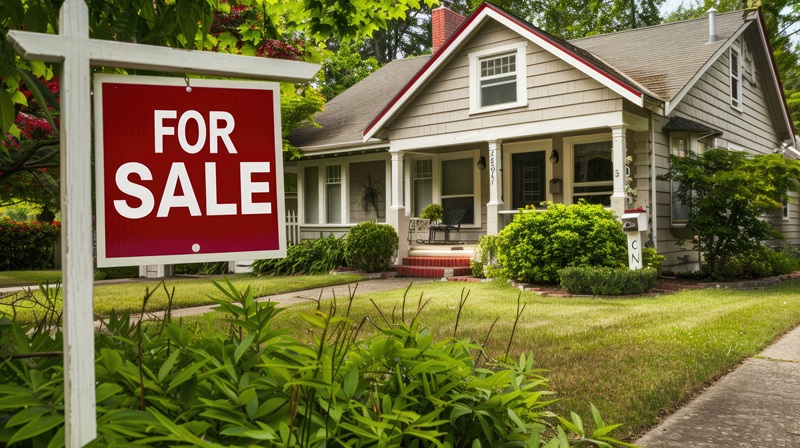
In what was described as the steepest annual decline in Realtor.com data since 2017, asking prices for homes fell 2.5% year over year in June.
It was the eighth consecutive month of price drops, according to the Realtor.com June 2026 Monthly Housing Trends Report. Pending sales increased 3.7% year over year for the seventh straight month of growth, and for the first time in 26 months, homes spent no more time on market than they did a year earlier. That’s a further indication that homebuyers are showing up as the market rebalances, according to the report.
“Eight straight months of falling prices and seven straight months of rising pending sales are not a contradiction. And they have to be considered together to get a full picture of what’s happening in housing right now,” Realtor.com Chief Economist Danielle Hale said. “Sellers are reading market conditions and are pricing accordingly from the start rather than listing high and cutting later, and buyers are taking note and making bids. This is a welcome sign that we are in a functioning market.”
The national median list price was $430,000 in June, essentially flat from May but down 2.5% from a year ago, a slightly steeper decline than May’s drop of 2.4%, Realtor.com noted. Price per square foot, which controls for changes in the size mix of homes on the market, fell 2.1% year over year. Realtor.com noted that the share of listings with a price reduction came in at 18.8%, down 1.9 percentage points from a year ago even as it rose from May’s 17.5%, the typical seasonal pattern as spring listings age into summer, Realtor.com said.
Regional Price Show Two Different Market
The regional picture revealed two very different housing markets, Realtor.com stated.
Year-over-year median list price declines ranged from -4% in the West to -2.5% in the South and -1% in the Northeast, while the Midwest crossed back to flat (0.0%). When adjusting for home size, price per square foot rose in the Midwest (+1.5%) and Northeast (+0.9%), while the South (-3.2%) and West (-1.6%) continued to decline.
A longer view tells a sharper story, Realtor.com said.
National median list prices peaked at $449,000 in June 2022. Four years later, they are down 4.2% nationally, but the regional divergence is stark. Prices are down 7.3% in the West and 3.5% in the South since that peak, Realtor.com noted, while the Midwest is up 10% and the Northeast is up 12.6%. Among the top 50 metros, prices since June 2022 are down in 28 and up in 22, Realtor.com said.
“The two Americas story in housing is now four years in the making,” Realtor.com Chief Economist Jake Krimmel said. “In the West and South, prices gave ground back as affordability limits were tested. In the Midwest and Northeast, supply stayed tight enough and demand strong enough that prices kept climbing even through a historic rate shock. The national number hides two opposing trends under the surface.”
Turning back to year-over-year trends, Realtor.com noted that the median list price per square foot is falling in 33 of the top 50 metro areas. The steepest per-square-foot declines were in Austin, Texas (-8.2%), Memphis, Tennessee (-6.0%), and Buffalo, New York (-5.2%). On the other end, Providence, Rhode Island (+8.7%), Indianapolis (+4.9%), and New York (+3.4%) posted the largest gains, each notably in the Northeast or Midwest.
Pending Sales Rise for a Seventh Straight Month
The stock of listings in pending status (also known as ‘under contract’) was up 3.7% year over year in June, extending the growth streak to seven consecutive months, the longest such run since December 2020 through June 2021, Realtor.com noted. And there is no sign that rising pending sales are masking a wave of broken deals: contract cancellations in April and May came in at 6.9% of pending sales, just below the 7.3% rate a year ago.
Realtor.com said that taken together, the data pushes back on the concern that rising pending sales are masking a wave of deals falling apart. Homes are going under contract, and they are staying there.
New listings rose 2.4% year over year to 463,480, led by strong gains in the Northeast (+12.6%) and supported by modest growth in the Midwest (+1.0%), South (+1.0%) and West (+0.2%), Realtor.com said.
The website noted that one concern entering summer was whether sellers would pull listings at the pace seen last year. That fear has not materialized, Realtor.com noted. Delistings — homes pulled from the market without a sale — are now down nearly 10% year over year in June, and sit at roughly 5% of active listings, near their lowest share since last year’s surge began, Realtor.com said.
Active inventory reached 1,102,615 in June, up 4.1% from May and 1.9% from a year ago, Realtor.com said. Year-over-year growth slowed slightly from 2.2% last month, extending a gradual cooling trend that has been running since last spring. Nationwide inventory remains 11.3% below typical 2017–2019 levels, a slightly wider gap than the 10.4% shortfall recorded in May, the website said.
Inventory Gains
Inventory gains were led by the Northeast (+8.5% year over year) and Midwest (+7.3%), while the South (-0.1%) and West (+0.3%) were nearly flat. Among the top 50 metros, 35 recorded year-over-year inventory growth, Realtor.com noted. The sharpest increases were in Louisville, Kentucky (+28.7%), Buffalo (+27.7%), and Seattle (+20.6%).
The median home spent 53 days on the market in June, which was identical to the same month last year. That ended a streak of 26 consecutive months in which homes sold more slowly than the prior year — a notable milestone that suggests the market’s slowing has fully normalized, Realtor.com noted. The median home is spending the same amount of time on market as the pre-pandemic norm.
The regional picture varies, but not nearly as much as other metrics.
Realtor.com noted that time on market is lower than a year ago in the Northeast (-2 days), where fresh inventory appears to be energizing transactions in historically tight markets. Days on market rose modestly in the Midwest (+3) and West (+2), and held flat in the South. At the metro level, time on market fell the most in Jacksonville, Florida (-8 days) and Richmond, Virginia (-6 days), while Boston, Memphis, and Oklahoma City each saw increases of six days.
What’s in store in July?
“July is when the market traditionally takes its foot off the gas — spring listings age, buyer urgency fades, activity slows,” Krimmel said. “June already shows the first signs of a slight seasonal slowdown: price cuts ticked up to 18.5% of current listings, and new listings were flat from last month even as they remained above last year. We’ll be watching whether homes start sitting longer, whether price cuts accelerate beyond the usual summer ramp up, and whether new listings genuinely pull back or just flatten out. So far, the leading indicators are holding, so we do not expect the market to stall out like it did last summer.”