



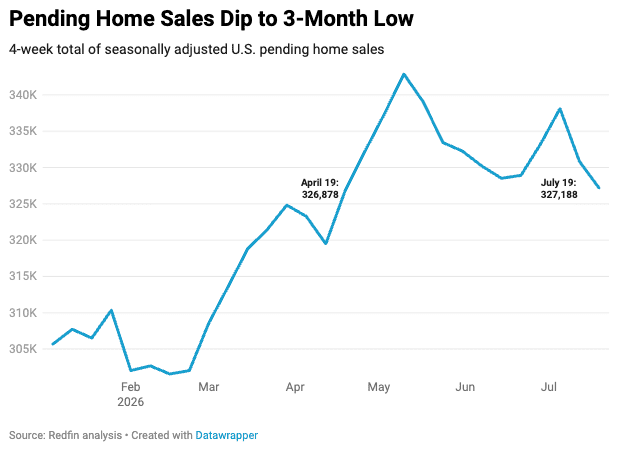
U.S. pending home sales experienced a decline of 1.3% week-over-week (WoW), reaching their lowest point in three months for the four-week period ending July 19, according to new Redfin research.
This decrease in homebuying interest coincides with weekly average mortgage rates climbing to an 11-month high of 6.55%. Furthee, home prices remain persistently elevated, just approximately $900 below their historical peak. The fluctuating U.S. economy, which includes the revival of the Iran conflict and increasing oil prices, is another element causing potential homebuyers to hesitate.
“The buyers who are in the market have more leverage than they’ve had in years,” said Vanessa Leimback, a Redfin Premier agent in Seattle. “Homes that have been sitting on the market for longer than a few weeks often come with room to negotiate on price and seller concessions. But buyers should remember that desirable, move-in ready homes can still be competitive because many people don’t want to take on renovation costs while mortgage payments are high. That’s why the biggest bargains are often on fixer-uppers.”
Key Highlights (Four weeks ending July 19, 2026):
| Metric | Four weeks ending July 19, 2026 | Year-over-year (YoY) change | WoW change (where applicable) |
| Median sale price | $408,795 | 2.5% | |
| Median asking price (seasonally adjusted) | $400,257 | 2.3% | |
| Median monthly mortgage payment (seasonally adjusted) | $2,618 at a 6.55% mortgage rate | 0.7% | |
| Pending sales (seasonally adjusted) | 327,188 | 3.1% | -1.3% |
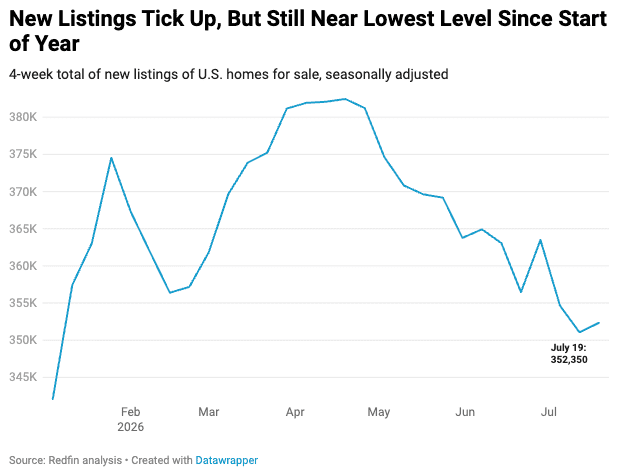
| New listings (seasonally adjusted) | 352,350 | 0.5% | 0.4% |
| Active listings (seasonally adjusted) | 1,485,408 | 0.5% | -0.1% |
| Months of supply | 3.4 | -0.2 pts. | |
| Share of homes off market in two weeks | 31.7% | Down slightly | |
| Median days on market | 41 | +1 day | |
| Share of home listings with price drops | 20.2% | Down from 21% | |
| Share of homes sold above list price | 28.3% | Up slightly | |
| Average sale-to-list price ratio | 99.1% | Up slightly |
Note: Redfin’s national metrics include data from 900+ U.S. metro areas and are based on homes listed and/or sold during the period. Weekly housing-market data goes back through 2021. Data is subject to revision.
On the sales side, there was an estimated 0.4% rise in new listings WoW, although they are still at their second-lowest point since early 2026. Some prospective sellers are choosing to wait, hoping for a boost in overall demand.
Metro-Level Highlights (Four weeks ending July 19, 2026):
Top five metros with biggest YoY increases in pending sales:
- West Palm Beach, FL (13.2%)
- Austin, Texas (10.8%)
- New York (9.8%)
- Boston (9.5%)
- Nassau County, NY (8.2%)
Top five metros with biggest YoY decreases in pending sales:
- Seattle (-14.5%)
- Houston (-13.6%)
- Phoenix (-8.3%)
- Denver (-6.5%)
- Miami (-2.8%)

Top five metros with biggest YoY increases in new listings:
- St. Louis (13.2%)
- Anaheim, CA (10.7%)
- Pittsburgh (9.3%)
- Boston (9.3%)
- Warren, MI (8.8%)
Top five metros with biggest YoY decreases in new listings:
- Fort Worth, Texas (-11.9%)
- Dallas (-10.7%)
- Miami (-8.9%)
- Atlanta (-8.1%)
- San Antonio (-6.8%)

Top five metros with biggest YoY increases in median sale price:
- West Palm Beach, FL (11%)
- Pittsburgh (7.2%)
- Virginia Beach, VA (6.9%)
- Detroit (6.7%)
- Philadelphia (6.5%)
Overall, the median sale price declined in eight metros nationwide.
Top five metros with biggest YoY decreases in median sale price:
- San Jose, CA (-3.3%)
- Seattle, WA (-3.2%)
- Nashville, TN (-0.9%)
- Los Angeles (-0.8%)
- Boston (-0.8%)

“Some homes are moving fast, others are seeing multiple price reductions,” said James Gulden, a Redfin Premier agent in Boston. “It’s not location or price-tier specific; the mixed results permeate in every corner of the market. Prices are still as high as they have ever been, but with homes sitting longer, the market is slowly turning in buyers’ favor.”
Note: Redfin’s metro-level data includes the 50 most populous U.S. metros. Select metros may be excluded from time to time to ensure data accuracy.