


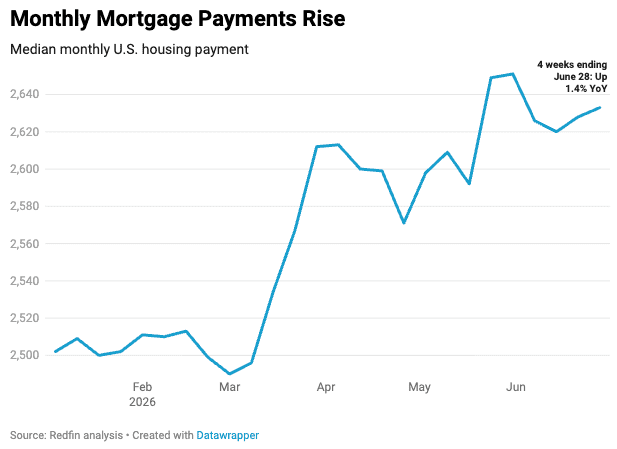
In June, Redfin data showed that the median housing payment in the U.S. experienced its first year-over-year rise since October, as home prices and mortgage rates continued to rise, with pending home sales ticking up week-over-week (WoW).
The average median sale price was an estimated $408,838 during the four weeks ending June 28, marking a record high and a near-3% year-over-year (YoY) change.
U.S. Highlights — June 28, 2026:
| Metrics | Four weeks ending June 28 | YoY change | WoW change (where applicable) |
| Median sale price | $408,838 | 2.5% | |
| Median asking price (seasonally adjusted) | $404,414 | 3.7% | |
| Median monthly mortgage payment (seasonally adjusted) | $2,633 at a 6.49% mortgage rate | 1.4% | |
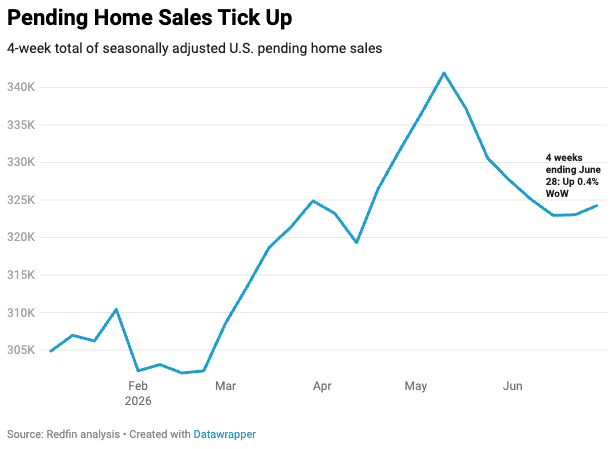
| Pending sales (seasonally adjusted) | 324,251 | 2% | 0.4% |
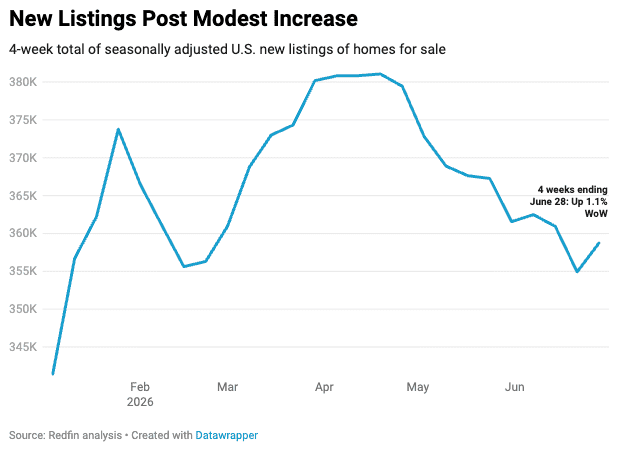
| New listings (seasonally adjusted) | 358,736 | 1.7% | 1.1% |
| Active listings (seasonally adjusted) | 1,476,146 | -0.1% | -0.1% |
Note: Redfin’s national metrics include data from 900+ U.S. metro areas and are based on homes listed and/or sold during the period. Weekly housing-market data goes back through 2021. Subject to revision.
This comes after monthly payments increased in April—for the first time in six months—due to rising mortgage rates and escalating home prices. This was driven by the conflict in Iran, significantly contributing to the rise in U.S. mortgage rates. As a result, some potential homebuyers were hesitant due to the elevated costs and the uncertainty associated with the war.
In April, the daily average mortgage rates increased as high as 6.64%. Additionally, home-sale prices have also played a significant role, with the median home-sale price experiencing an estimated 2.1% rise compared to the same period last year during the four weeks ending on March 29—representing the largest increase in a year.
“My advice for sellers is to remember you’re selling the dream of homeownership,” said Hazel Shakur, a Redfin Premier agent in the Washington, D.C. area. “When house hunters walk through the door, it should look good, smell good and give the impression that every room is orderly. Buyers should be able to visualize what life is going to be like living in the home. And it goes beyond cosmetics: Some buyers are walking away during the inspection period if they uncover an issue, so sellers should make sure they have taken care of basic maintenance and repairs before listing.”
Metro-Level Highlights — June 2026:
Top five metros with biggest YoY increases in median sale price:
- San Francisco (10.8%)
- West Palm Beach, FL (10.6%)
- Pittsburgh (9.1%)
- Philadelphia (8.7%)
- Detroit (8.2%)
Overall, the median sale price declined in eight metros nationwide.
Top five metros with biggest YoY decreases in median sale price:
- Seattle (-5.3%)
- San Jose, CA (-4%)
- Riverside, CA (-1.8%)
- Portland, OR (-1%)
- Dallas (-0.6%)
Top five metros with biggest YoY increases in pending sales:
- San Francisco (17%)
- Austin, TX (14.2%)
- West Palm Beach, FL (10.9%)
- Milwaukee (10.8%)
- Cincinnati (9.5%)
Top five metros with biggest YoY decreases in pending sales:
- Seattle (-14.7%)
- Houston (-14%)
- Detroit (-11.3%)
- Warren, MI (-8.6%)
- Atlanta (-5.3%)
Top five metros with biggest YoY increases in new listings:
- Philadelphia (15.7%)
- Anaheim, CA (15.2%)
- St. Louis (12.4%)
- Pittsburgh (11.9%)
- Boston (11.4%)
Top five metros with biggest YoY decreases in new listings:
- Dallas (-11.8%)
- Fort Worth, Texas (-8.2%)
- Jacksonville, FL (-7.3%)
- Atlanta (-5%)
- San Jose, CA (-4.2%)
Note: Redfin’s metro-level data includes the 50 most populous U.S. metros. Select metros may be excluded from time to time to ensure data accuracy.