According to a recent analysis of the U.S. Census Bureau’s 2022 American Community Survey (ACS) by Zillow and its New York City brand StreetEasy, rent expenses affect nearly half of all renter households in the U.S., with Gen Z renters bearing the brunt of the strain.
Some three out of five Gen Z renters (those between the ages of 18 and 25) nationwide spend more than 30% of their income on housing costs. That percentage is significantly higher in 21 of the 30 biggest metro areas in the nation. For instance, almost three-quarters of Gen Z tenants in cities like San Diego, Los Angeles, and Sacramento are burdened by their rent.
The situation facing Gen Zers today is comparable to that of millennials ten years ago, albeit marginally better. Rent accounted for more than 30% of the income of 60.2% of Millennials nationally in 2012. Young adults’ rent burden peaked in 2011 at 62%, but by 2019, it has gradually decreased to 55%. The trend has since flipped, though, as decades of undersupply combined with the pandemic’s spike in rental demand have resulted in steep price rises across.
“The experience of struggling to pay rent on an entry level salary is familiar to so many of us that it’s almost become normalized in our society,” said Kenny Lee, Senior Economist at StreetEasy. “But this is something that should not be normal. Rent burden makes it a struggle for these young adults to afford the other expenses in their lives—things like student loans and medical payments. It’s deeply damaging to their ability to save for future life goals, like one day owning a home.”

Key Findings:
- Some 58.6% of Gen Z renters nationwide are rent burdened, though 60.2% of Millennials experienced rent burden at the same age.
- In more than half of the 30 largest U.S. metros, millennials in 2012 were more likely to be rent burdened than Gen Z renters at the same age in 2022.
- Over the past decade, rent burden for young adults has decreased the most in Austin and increased the most in Houston.
- Reducing the lock-in effect by lowering upfront rental costs will give all New Yorkers expanded choices in the rental market and improved financial ability to move, leading to a healthier marketplace where renters can afford more homes, and more homes become available as more renters choose to move.
Millennials in 2012 were more likely than Gen Z renters in 2022 to face rent stress in 17 of the nation’s 30 major metro areas. The progress has been slight, though. Rent hardship affects at least half of Gen Z renters in each of those 30 metro areas. Over the past ten years, Austin has seen the biggest drop in the percentage of young adults who are rent-burdened (-9.5%), whereas Houston has seen the most significant increase (11.9%).
“While these large metropolitan areas may be known to have more expensive housing, we have to recognize that they’re also where the jobs are,” said Emily McDonald, Rental Trends Expert at Zillow. “For many Gen Z renters, choosing to live in a less expensive city may come at the expense of their career, which is why it’s so necessary we find ways to make living in these areas more affordable for young adults.”
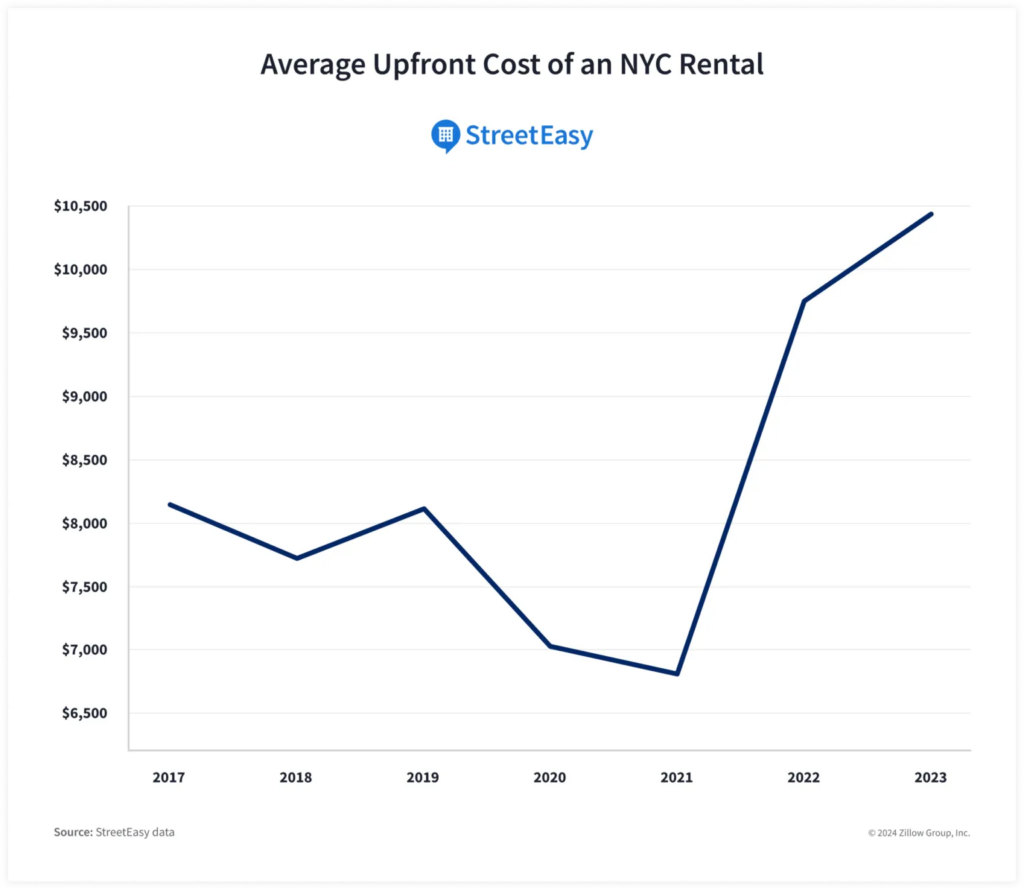
Finding a rental can be expensive up front, and Zillow research indicates that renters of color typically incur higher upfront fees. Broker fees are frequently the biggest expense, with upfront costs in New York City averaging close to $10,500. One of the reasons Zillow and StreetEasy are supporting broker fee reform is to reduce upfront rental fees, which will increase rental options for all New Yorkers.

Share of Cost-Burdened Households Outnumbers Number of Available Vouchers
However, despite rent hikes having decreased over the last few years, U.S. incomes still haven’t caught up. Because of this, a renter household’s monthly rent payment still represents a larger portion of their take-home salary than it did before to the epidemic.
For a significant portion of households that rent, the circumstances are very difficult. About 19 million people, or just under half of the 39 million households that rent in one of the 100 largest metro areas in the nation, must pay more than 30% of their monthly income in rent. It is customary to refer to households that are over this 30% threshold as “rent-burdened.”
Low-income renters have traditionally benefited greatly from rental assistance from the U.S. Department of Housing and Urban Development (HUD), especially through the use of Housing Choice Vouchers (HCVs). For many renters who are struggling financially, vouchers are an essential source of support. Unfortunately, though, the demand for help has outpaced the quantity of available vouchers.
Many low-income households receive rent subsidies through Housing Choice Vouchers, commonly referred to as Section 8 vouchers. The participating household pays the landlord directly with the housing subsidy. The difference between what the landlord actually charges and what the program subsidizes is subsequently paid by the household. Usually, voucher holders pay 30% of their income in rent, with the government covering the remaining amount up to a rent cap. This rent cap is based on HUD-constructed estimates of “fair market rent” at the county or metro level. The Zillow Observed Rent Index (ZORI), which HUD has used in these forecasts since 2023, has improved the voucher program’s responsiveness to the state of the market.
Prior to the pandemic, the market was already struggling with funding limitations that have prevented many income-eligible households from receiving rental assistance. Since then, the need for vouchers has grown. Due to the sharp spike in market rents during the pandemic, there were more households in need of aid than there were vouchers available.
Where the Number of Rent-Burdened Households Exceeded the Number of Vouchers
There are millions of rent-burdened households in the country, meaning that rent takes up more than 30% of their monthly income. Roughly half of those, or 9.4 million households, were heavily indebted to rent, paying over half of their monthly income for rent.
Although the calculation for voucher eligibility is a little different, taking into account factors like family size and the family’s income in relation to the county or metropolitan area’s median income, the result is comparable: In 2022, up to 18.6 million households in the U.S. satisfied the income requirements for voucher eligibility. Due to restrictions on the amount of rental units at or below fair market rent and limitations related to immigration status, fewer households would be eligible even though aid was needed.
Only 2.4 million cost-burdened families and individuals receive assistance through the Housing Choice Voucher program overall, leaving millions behind. The probability of homelessness and eviction rises when rent rises more quickly than income. Eviction increases housing instability because it increases the possibility that an evicted family would apply for shelter and increases the risk that they will relocate again within two years of being evicted by 80% to 90%. Additionally, evictions have a significant detrimental effect on the health of evicted renters, increasing ER visits and hospitalizations for mental health issues. Reducing the increasing number of families experiencing homelessness would probably be aided by increased financing for the Housing Choice Voucher program.
Lower-Income New Yorkers Face Higher Barriers to Moving Within the City—Even Their Own Borough
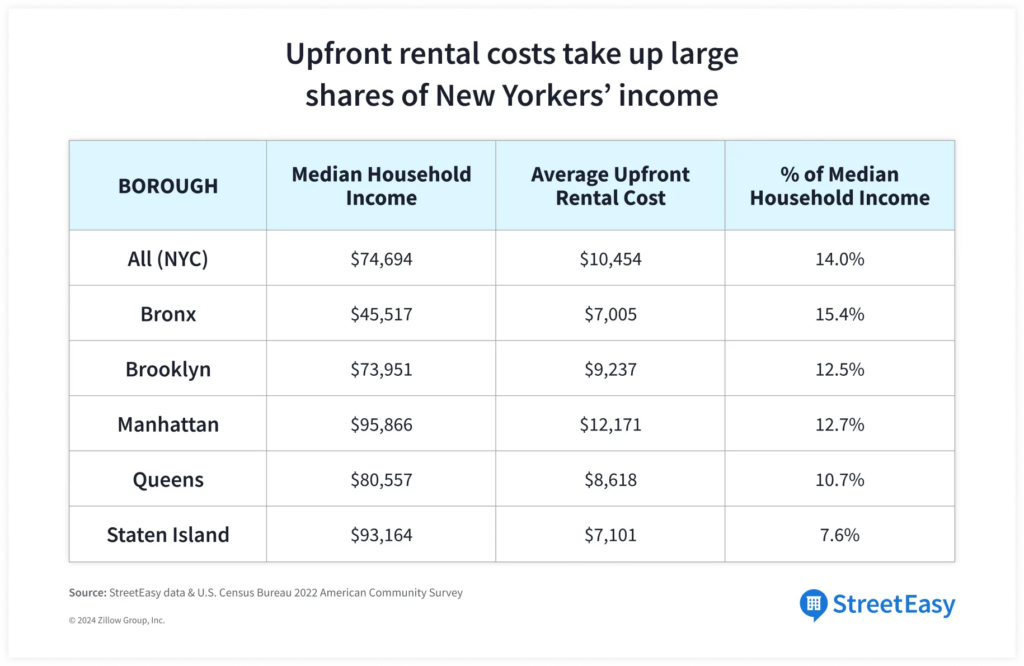
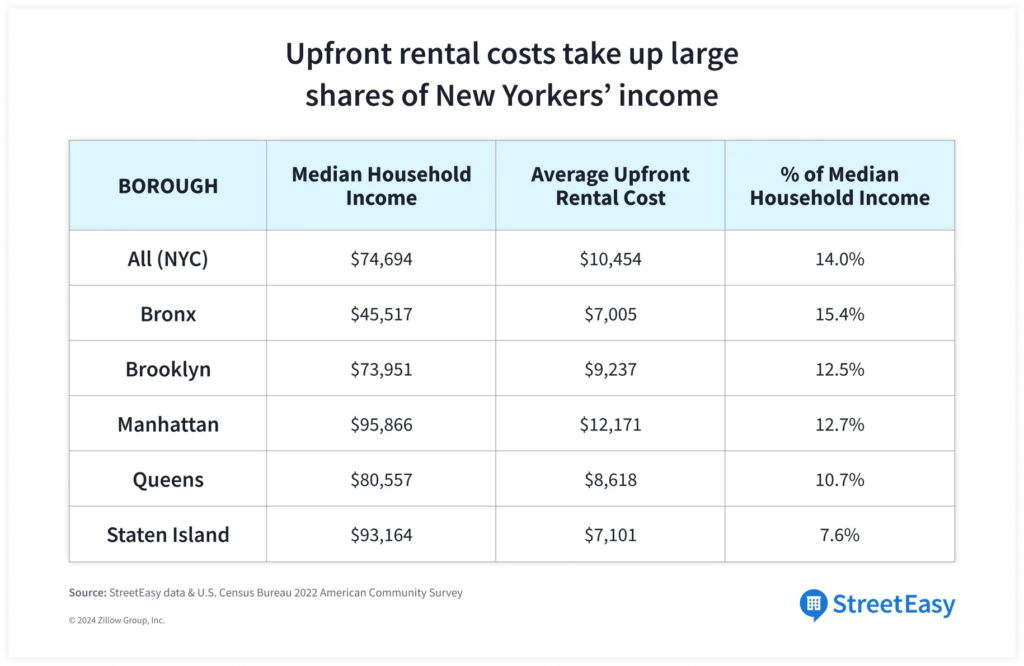
For many New Yorkers, relocating to or within New York City is extremely difficult due to the high upfront fees. In 2023, a New Yorker with the citywide median family income of $74,694 could only afford one in four (24.8%) market-rate apartments in the city after deducting annual rents and upfront expenses.
Many New Yorkers are already “severely” burdened by their rent: according to the NYC Housing Vacancy Survey, nearly one in three (32%) renters spend more than 50% of their income on rent, a trend that has persisted since 2005. We define “affordable” as rentals that cost less than 50% of a household’s combined annual income before taxes, taking into account NYC’s already high rent costs.

Unfortunately, the lock-in effect of upfront rental payments disproportionately affects many New Yorkers with lesser incomes. When thinking about relocating to another area of the city, or even within their own borough, people in outlying boroughs—where median salaries are lower than in Manhattan—face extra obstacles.
For instance, based on anticipated upfront expenses and annual rents in the area, New Yorkers in the Bronx with the borough median family income of $45,517 can afford less than one in ten (8.2%) of the borough’s rentals. Because they can only afford less than 1% (0.96%) of the rental inventory in other boroughs, these Bronx tenants have even fewer options in other parts of the city, where asking rents and upfront expenditures are far higher.
In contrast, Manhattan residents who make the borough median family income of $95,866 are able to purchase over one-third (35.5%) of the rental properties in their own borough. Additionally, they would be able to afford almost two-thirds (65.6%) of the rental inventory in other boroughs due to their higher median income and the comparatively lower upfront prices of rents outside of Manhattan.
Racial Disparities in Rent-Burdened Households
Different households and localities did not bear an equal share of these rent burdens. Compared to homes led by persons of other races, BIPOC (Black, Indigenous, and people of color) households pay more in rent. In particular, the average BIPOC renter household spent 34% of their income on rent in 2022, while the average white renter household only spent 29%. Research indicates that BIPOC households are more likely to experience homelessness because homelessness increases more quickly when rent affordability climbs above the 32% level.
However, the disproportionately larger financial burdens experienced by BIPOC households also make it more difficult for those who are still living to save money for down payments, which makes homeownership more elusive. Certain populations are priced out of both the rental and for-sale housing markets as a result, creating a highly unequal economy that highlights the need for housing aid.
To read the full report, including more data, charts, and methodology, click here.


