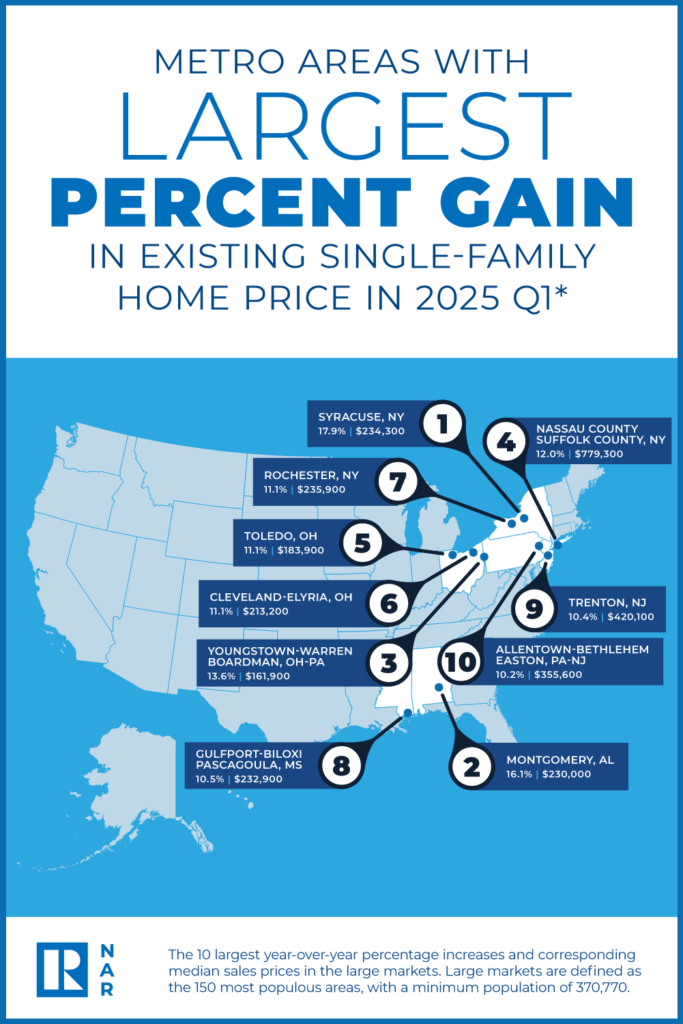
According to the most recent quarterly data from the National Association of Realtors (NAR), home prices increased in more than 80% of metro markets (189 out of 228, or 83%) in Q1 of 2025, while the 30-year fixed mortgage rate varied between 6.63% and 7.04%. Compared to 14% in tQ4 of 2024, just 11% of the 228 metro areas under study saw double-digit price increases within the same time frame.
The median single-family existing-home price nationwide increased 3.4% to $402,300 from a year ago. The national median price rose 4.8% year-over-year in the previous quarter.
With a 1.3% year-over-year price increase, the South had the highest percentage of existing-home sales (44.9%) among the major U.S. regions in Q1 Additionally, prices rose 4.1% in the West, 5.2% in the Midwest, and 10.3% in the Northeast.
“Most metro markets continue to set new record highs for home prices,” said Lawrence Yun, NAR Chief Economist. “In the first quarter, the Northeast performed best in both sales and price gains by percentage. Despite the stronger job additions, the South lagged with declining sales and virtually no price appreciation.”

Popular New York, Ohio Metros See YoY Gains
The top 10 large markets (where large markets are defined as the 150 most populous areas) with the biggest year-over-year median price increases by percentage all experienced gains of at least 10%. A total of six markets were in New York and Ohio.
Overall, those top 10 large markets were:
- Syracuse, NY (17.9%)
- Montgomery, AL (16.1%)
- Youngstown-Warren-Boardman, Ohio-PA (13.6%)
- Nassau County-Suffolk County, NY (12.0%)
- Toledo, Ohio (11.1%)
- Cleveland-Elyria, Ohio (11.1%)
- Rochester, NY (11.1%)
- Gulfport-Biloxi-Pascagoula, MS (10.5%)
- Trenton, NJ (10.4%)
- Allentown-Bethlehem-Easton, PA-NJ (10.2%)
“Very expensive home prices partly reflect multiple years of home underproduction in those metro markets,” Yun said. “Another factor is the low homeownership rates in these areas, implying more unequal wealth distribution. Affordable markets tend to have more adequate supply and higher homeownership rates.”
While it may come as no surprise to some, California was home to eight of the 10 costliest markets in the U.S.
The top 10 costliest markets were:
- San Jose-Sunnyvale-Santa Clara, CA ($2,020,000; 9.8%)
- Anaheim-Santa Ana-Irvine, CA ($1,450,000; 6.2%)
- San Francisco-Oakland-Hayward, CA ($1,320,000; 1.5%)
- Urban Honolulu, Hawaii ($1,165,100; 7.3%)
- San Diego-Carlsbad, CA ($1,036,500; 5.7%)
- Salinas, CA ($954,700; 6.2%)
- San Luis Obispo-Paso Robles, CA ($953,400; 4.8%)
- Oxnard-Thousand Oaks-Ventura, CA ($931,500; 2.5%)
- Naples-Immokalee-Marco Island, FL ($865,000; 1.8%)
- Los Angeles-Long Beach-Glendale, CA ($862,600; 4.8%)
U.S. Markets See Price Drops as Affordability Improves
Compared to 11% in Q4 of 2024, nearly 17% of markets (38 of 228) reported drops in home prices in Q1.
The first quarter saw a minor improvement in housing affordability. A typical existing single-family home with a 20% down payment had a monthly mortgage payment of $2,120, which was up 4.1%, or $84, from a year ago but only $2 less than Q4 of 2024 ($2,122). On average, families paid their mortgages with 24.4% of their income, which was lower than the previous quarter’s 24.8% and the previous year’s 24.5%.
For first-time purchasers, the affordability situation improved little over the previous quarter. For a typical beginning home with a 10% down payment loan, the monthly mortgage payment dropped to $2,079, just $2 less than the $2,081 payment from the previous quarter. The typical beginner home is worth $342,000. That was a 4.1% increase, or $82, over $1,997, a year ago. First-time homebuyers’ mortgage payments usually made up 36.8% of their family income, down from 37.4% in the previous quarter.
“A few areas where home prices declined a year or two ago are now rebounding, including Boise, Las Vegas, Salt Lake City, San Francisco and Seattle,” said Yun. “Similarly, some markets currently experiencing price declines—but with solid job growth—could see prices recover in the near future, such as Austin, San Antonio, Huntsville, Myrtle Beach, Raleigh and many Florida markets.”
In 45.1% of markets, a household had to earn at least $100,000 in qualifying income to qualify for a 10% down payment mortgage, compared to 43.8% in the previous quarter. However, in 3.1% of areas, a family had to earn less than $50,000 in qualifying income to afford a home, compared to 2.2% in the prior quarter.
The next quarterly Metropolitan Median Area Prices and Affordability and Housing Affordability Index release will be Tuesday, August 12, 2025, at 10 a.m. Eastern Time.
To read more, click here.


