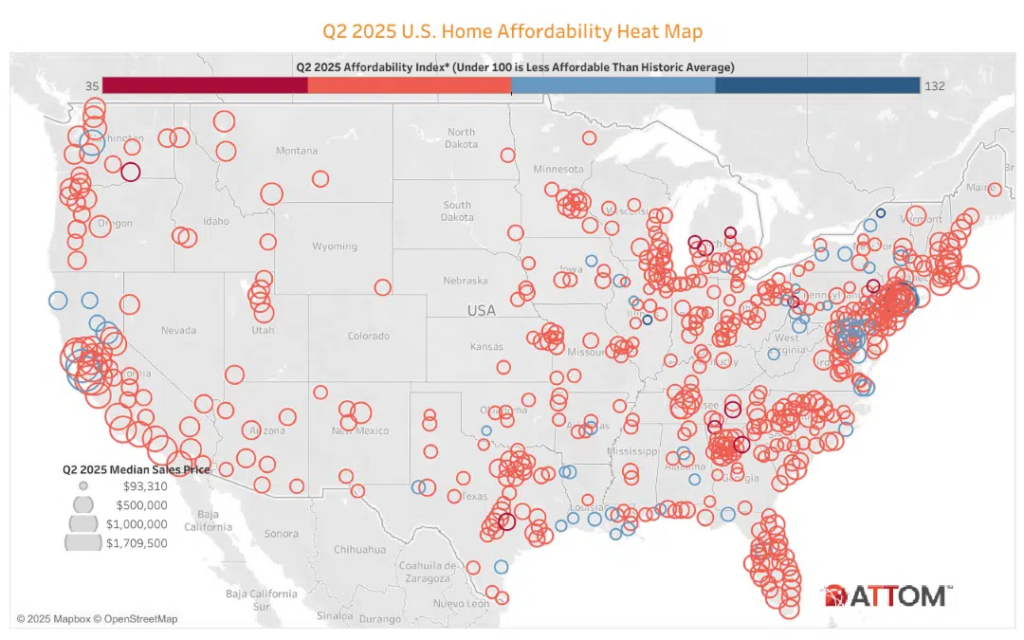
In an estimated 99% of counties with enough data to examine, median-priced single-family homes and condos were less affordable in Q2 of 2025 than historical norms, according to ATTOM’s most recent U.S. Home Affordability Report. For the fourteenth consecutive quarter, a larger proportion of the average owner’s income is needed to buy and maintain a median-priced property in the U.S. than has historically been required.
This comes after mortgage application payments increased in May, according to the Mortgage Bankers Association (MBA). With the national median payment requested by purchase applicants rising to $2,211 from $2,186 in April, homebuyer affordability continued to deteriorate in May.
“Homebuyer affordability declined in May as mortgage rates near 7% continued to put upward pressure on prospective homebuyers’ budgets,” said Edward Seiler, MBA’s Associate VP of Housing Economics, and Executive Director, Research Institute for Housing America. “Despite current affordability constraints, many homebuyers are still eager to enter the housing market. Rising inventory levels and moderating home-price growth have both been bright spots during this year’s spring homebuying season.”
Major expenses for a median-priced property in the U.S. would have taken up 33.7% of the average American’s yearly salary, according to ATTOM’s estimate. That was significantly higher than the 28% share that lenders usually advise, and it was up from 32% in Q1 of the year.

Median-Priced Homes Don’t Match Median-Earner Wages
As housing prices continue to climb, the affordability report draws attention to the difficulties that both current homeowners and potential buyers face. The median home price in the U.S. rose to $369,000 in Q2 of 2025, following a short decline from $355,000 in Q4 of 2024 to $350,275 in Q1 of 2025. At the same time, the average rate for a 30-year fixed mortgage was 6.82%.
“The squeeze is really on for would-be buyers as we go into the summer, which is usually when the housing market is most active,” said Rob Barber, CEO of ATTOM. “Prices just continue to rise and there’s been no relief on mortgage rates. Meanwhile, typical wages are barely increasing from quarter-to-quarter.”
The median price to buy a home in the U.S. has increased by 55.7% from Q1 of 2020. In contrast, the average salary in the U.S. has only increased by 26.6%. (The U.S. Bureau for Labor Statistics’ most recent pay data is for Q4 of 2024.)
By estimating the monthly income required to cover the major costs of homeownership, such as mortgage payments, mortgage insurance, property taxes, and homeowner’s insurance, on a median-priced single-family home and condo, assuming a 20% down payment and a maximum “front-end” debt-to-income ratio of 28%, ATTOM calculates affordability for average wage earners.
From Q1 of 2025, the median price of single-family homes and condominiums nationwide increased by 5% to reach a peak of $369,000. Additionally, it was 3% greater than it was at the same time last year. In 382 (66%) of the 579 counties examined, median home prices have increased annually. Counties with a population of 100,000 or more, at least 50 single-family home and condo sales, and adequate data from Q2 of 2025 are included in the report.
Regional Highlights — National
The areas that saw the largest median home price increases over the previous year were in:
- Bronx County (New York City), NY (up +14%)
- Suffolk County (Long Island), NY (+6%)
- Queens County (New York City), NY (+6%)
- Philadelphia County, PA (+6%)
- Hennepin County (Minneapolis), MN (+5%)
The counties with the largest year-over-year (YoY) median home price declines were in:
- Contra Costa County (outside San Francisco), CA (down -5%)
- Travis County (Austin), Texas (-4%)
- Alameda County (Oakland), CA (-3%)
- New York County (Manhattan), NY (-3%)
- Hillsborough County (Tampa), FL (-3%)

In 99.3% (575) of 579 counties with enough data to evaluate, owning a median-priced home in Q2 of 2025 was less inexpensive than historical norms. This was a modest increase from the previous quarter, when 96.9% of counties had lower house ownership affordability than had previously been the case.
Home expenses in Q2 of the year exceeded 28% of the average resident’s salary in 77.9% (451) of the 579 counties, making homeownership unaffordable by conventional standards. That included some of the nation’s most populous counties (with populations over 1 million) such as:
- Los Angeles County, CA
- Cook County, IL (Chicago)
- Maricopa County, AZ (Phoenix)
- San Diego County, CA
- Orange County, CA (outside Los Angeles)
The most populated counties where the average resident’s wages were less than 28% of their major household expenses were in:
- Harris County, Texas (Houston)
- Wayne County, MI (Detroit)
- Philadelphia County, PA
- Cuyahoga County, Ohio (Cleveland)
- Allegheny County, PA (Pittsburgh)
Overall, in Q2 of 2025, homeownership was less inexpensive than the historical average for 99.3% (575) of the 579 counties that were examined.
To read more, click here.


