


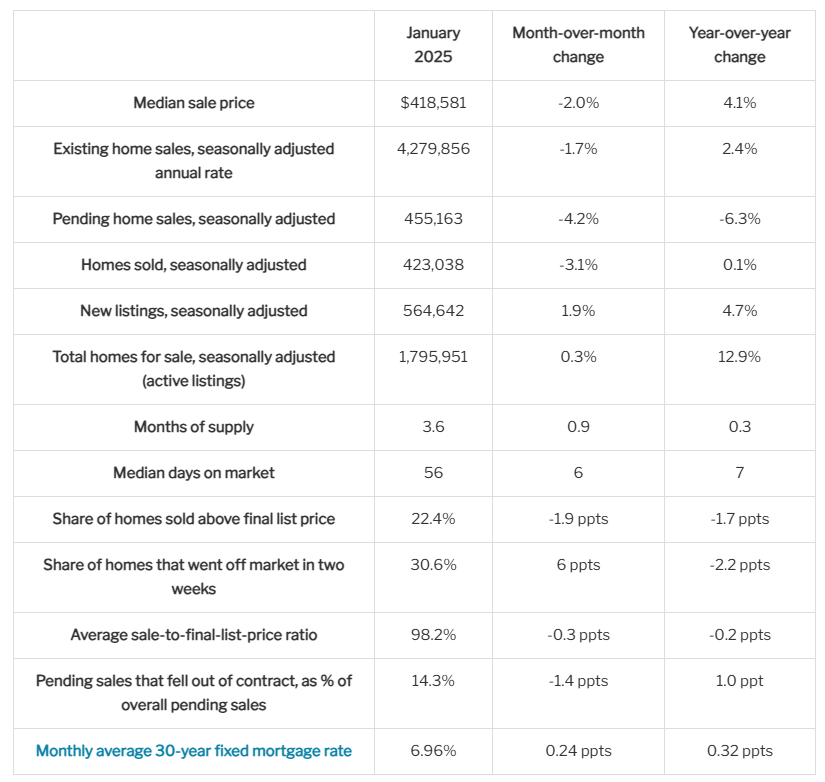
According to a new report from Redfin, homebuyers have the most options since 2020, but few are biting because rising housing costs have made monthly payments tough to swallow. Redfin found that pending home sales in January fell to the lowest level on record aside from the start of the pandemic. Pending home sales dropped 4.2% month-over-month—the largest decline on a seasonally adjusted basis reported since August 2023—and 6.3% year-over-year.
Active listings of homes for sale rose to the highest level since early in the pandemic. They climbed 0.3% month-over-month on a seasonally adjusted basis in January and 12.9% year-over-year. New listings hit the highest level since July 2022, increasing 1.9% month-over-month, and 4.7% year-over-year.
Redfin cited a number of reasons for this increase in the nation’s housing inventory, including:
- The mortgage rate lock-in effect is fading: A number of homeowners who scored low mortgage rates during the pandemic have been staying put because moving would mean taking on a higher rate. But most people can’t stay put forever.
- Homes are lingering on the market: The typical home that sold in January was on the market for 56 days. That’s a week longer than a year earlier, marking the longest period for any January since 2020.
- Demand is slowing: Listings are also piling up because there are fewer people buying homes. Existing home sales fell 1.7% in January to a seasonally adjusted annual rate of 4.3 million—the largest monthly decline since October 2023.
Redfin cited a number of reasons for this dip in housing sales, including:
- Mortgage rates hit an eight-month high: As the third quarter brought with it a drop in mortgage rates, 2024 closed with the 30-year fixed-rate mortgage rate edging toward the 7% mark. The average interest rate on a 30-year-fixed mortgage was 6.96% in January, up from 6.72% a month earlier and the highest level since May. Plus, the median home sale price rose 4.1% from a year earlier to $418,581. That’s 45% higher than the January before the pandemic.
- Deals are falling through: Home purchases were canceled at the highest January rate in records dating back to 2017. Roughly 41,000 home-purchase agreements were canceled, equal to 14.3% of homes that went under contract last month. That’s up from 13.4% a year earlier.
- Economic uncertainty: With tariffs, reductions in the federal workforce, return to office mandates, and mortgage rate uncertainty, a lot is up in the air for a lot of Americans right now, and Redfin agents report this is giving buyers (and sellers) cold feet.
“I’m seeing a lot more inventory hit the market than I have in past years, but it’s not nearly enough,” said Charles Wheeler, a Redfin Premier Real Estate Agent in San Diego. “Economic fears have been top of mind for people. I have sellers saying, ‘I think we’re at the top of the market—I’m ready to cash out and put my money into another investment.’ Buyers should know that they have a bit more negotiating power because there are more homes hitting the market. Sellers should know that since buyers have more negotiating power, they should make sure their home is polished and competitively priced if they want to sell it quickly.”
January 2025 Housing Market Highlights: United States
Metro-Level Highlights: January 2025
- Prices: Median sale prices rose most from a year earlier in Pittsburgh (15.4%); St. Louis (13.2%); and Anaheim, California (13.1%). They fell in four metros: Tampa, Florida (-4%); Austin, Texas (-3.7%); San Francisco (-2.2%); and Jacksonville, Florida (-1.3%).
- Pending sales: Pending sales rose most in Portland, Oregon (11.4%); San Jose, California (8.2%); and Milwaukee (4.7%). They fell most in Detroit (-19.2%); Miami (-18.1%); and Atlanta (-17.4%).
- Closed home sales: Home sales rose most in Portland, Oregon (12.8%); Providence, Rhode Island (10%); and Boston (9.9%). They fell most in Detroit (-11.3%); Miami (-9.4%); and Fort Lauderdale, Florida (-8.2%).
- New listings: New listings rose most in Seattle (30.8%); Oakland, California (27.7%); and Sacramento, California (25%). They fell most in Kansas City, Missouri (-11.2%); Detroit (-9.1%); and Pittsburgh (-8.4%).
- Active listings: Active listings rose most in Oakland (31.1%); Seattle (29.1%); and Cincinnati (28.1%). They fell in six metros, with the largest declines reported in New York (-3.9%); Newark, New Jersey (-1.9%); and Chicago (-1.5%).
- Homes sold above list price: In Newark, 56.7% of homes sold above their final list price, the highest share among the metros Redfin analyzed. Next came San Jose (52.7%); and Nassau County, New York (49%). The lowest shares were in West Palm Beach, Florida (5.5%); Fort Lauderdale (5.9%); and Miami (7.5%).
Click here for more on Redfin’s analysis of January 2025 home sale trends.