



The growth of home prices is now anticipated to decelerate to merely 1.2% in 2026, a rate slower than previously predicted and one that does not keep up with inflation, indicating that home prices are effectively decreasing in real terms, according to the Realtor.com 2026 Forecast Midyear Update. This slowdown in home price growth occurs as a robust economy has maintained elevated mortgage rates, counteracting the rate relief experienced earlier in the year.
Additionally, Realtor.com has revised its 2026 forecast for existing-home sales to 4.10 million, a decrease from the 4.13 million estimated in December. Nevertheless, the number of sales is still projected to increase by 1.0% compared to 2025, as momentum is expected to build in the latter half of the year. In contrast, rental prices are projected to decline once more in 2026.
“Against a backdrop of both familiar and new challenges, the economy has proved resilient. As a result, the first half of 2026 delivered stability more than momentum in the housing market,” said Danielle Hale, Chief Economist at Realtor.com “The housing market is inching forward as sellers reset expectations, price growth cools, and buyers gain more negotiating power. Looking ahead, we expect momentum to build through the second half of the year as more sidelined buyers and sellers find terms that work for both sides.”
Realtor.com 2026 Forecast for Key Housing Indicators:
| Metrics | 2026 Realtor.com Forecast (Revised) | 2026 Realtor.com Forecast (Dec 2025) | 2025 Historical data | 2013-2019 Historical average |
| Mortgage Rates | 6.3% (avg)6.3% (year-end) | 6.3% (avg)6.3% (year-end) | 6.6% (avg)6.3% (year-end) | 4.0% (avg) |
| Existing Home Median Price Appreciation (Y/Y) | +1.2 % | +2.2 % | +2.0 % | +6.5 % |
| Monthly Mortgage Payment (Y/Y) | -1.9 % | -1.3 % | +1.9 % | +7.0 % |
| Existing Home Sales (Y/Y | Annual Total) | +1.0% 4.10 million | +1.7%* 4.13 million | +0.1% 4.06 million | +2.1% 5.28 million |
| Existing Home For-Sale Inventory (Y/Y) | +3.6 % | +8.9 % | +15.2 % | -3.6 % |
| Single-Family Home Housing Starts (Y/Y | Annual) | +2.0% 0.96 million | +3.1%* 1.00 million | -4.3% 0.97 million | 0.77 million |
| Homeownership Rate | 65.1 % | 64.8 % | 65.1 % | 64.2 % |
| Rent Growth | -1.2 % | -1.0 % | -1.5 % | +5.2 % |
Note: Growth rate as published calculated from then-projected 2025 totals, existing home sales of 4.07M and single-family starts of 0.97 million.
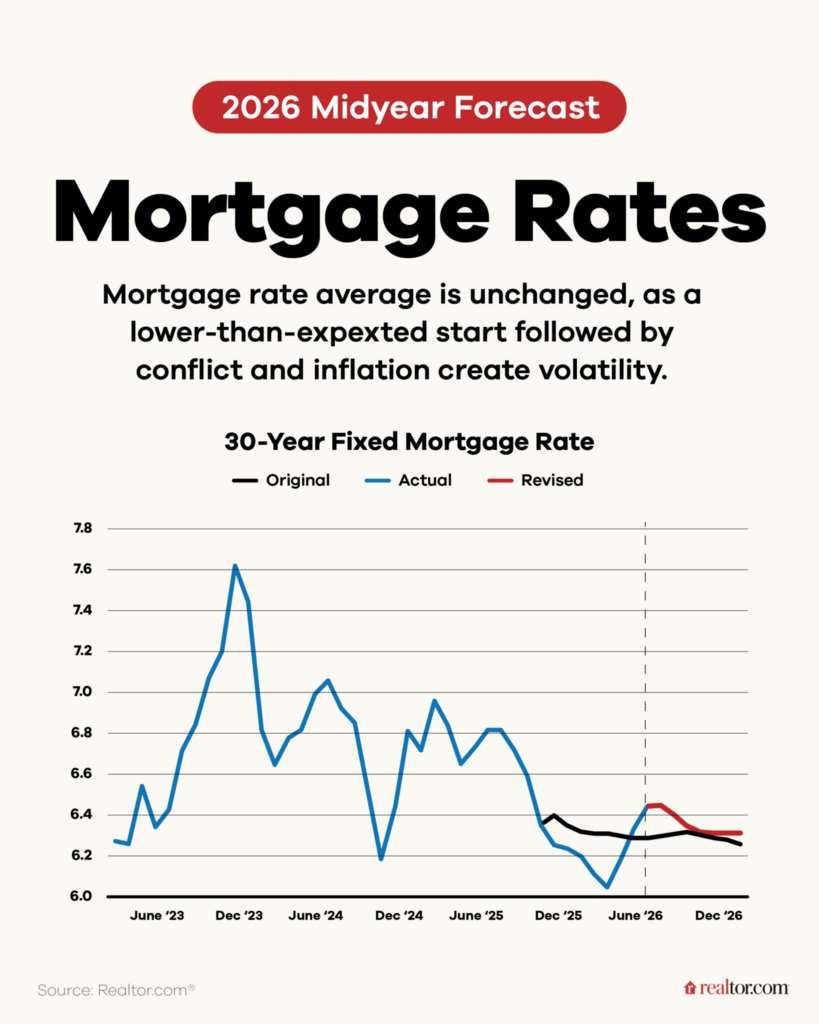
Mortgage rate forecasts remain steady at 6.3%, as a new wave of inflation coupled with economic strength, especially in the labor sector, has counterbalanced the lower-than-anticipated rates observed in the initial months of the year. Inflation reached a three-year peak of 4.2% in May, erasing the wage increases for that month and heightening concerns regarding widespread price pressures. The Federal Reserve’s June announcement, made following Chair Kevin Warsh’s inaugural meeting, explicitly committed to achieving price stability, which has raised expectations for short-term interest rate increases.
The timing suggests that geopolitical factors are influencing this change: prior to the February strikes on Iran, markets had anticipated one to two rate reductions by December, but they now foresee one to two rate increases instead — a nearly one-point shift attributed to the conflict’s impact on oil prices and inflation. Nevertheless, the 10-year yield has remained stable between 4% and 4.5%, which has kept mortgage rates within the 6%–6.5% range throughout the year.
Home Sale Activity, Price Growth & More
Home sales in 2026 are projected to experience a slight year-over-year increase, reaching 4.1 million, which is slightly below our initial forecast. Existing-home sales lagged behind the previous year’s figures in January, February, and March, despite mortgage rates briefly falling below 6% at the end of February. The outbreak of conflict in the Middle East caused rates to rise again, raising concerns that buyers might withdraw from the market. However, sales stabilized in April and showed a more significant increase in May. Year-to-date, existing-home sales are currently 0.2% ahead of last year’s figures. Realtor.com® anticipates that growth will accelerate in the latter half of 2026, although it will be less than previously predicted, resulting in an annual total of 4.10 million, which represents a 1.0% increase from 2025.
“Buyers and sellers have shown a lot of staying power this year,” Hale said. “This is a market where people are adjusting and showing up rather than giving up. Sellers are meeting the market with more realistic asking prices, which is helping deals get done.”
The home price forecast has been adjusted downward to 1.2% for the year, indicating a slower growth rate than previously anticipated. Year-to-date, prices have increased by just under 1% compared to the previous year. Realtor.com®’s updated forecast indicates a deceleration in growth, reflecting more balanced and even buyer-friendly conditions in numerous markets. Sellers have responded by reducing their asking prices initially rather than making cuts later, resulting in fewer price reductions on listings compared to last year.
Affordability has improved more than initially projected: the typical monthly payment for buyers in 2026 is now expected to be 1.9% lower than last year’s, surpassing the original forecast’s 1.3% decrease, as the outlook for mortgage rates has remained stable while expectations for price growth have diminished. Coupled with stronger income growth, this results in a smaller portion of income being required to meet housing payments. With inflation anticipated to be at 3.4% for the year, home price growth is unlikely to keep pace with inflation. Consequently, housing costs for buyers are effectively decreasing in relation to other household expenses.
The sales data from May, along with a first-quarter homeownership rate of 65.3% that exceeded expectations, has led to an upward adjustment in Realtor.com’s forecast for homeownership for the entire year. Young households continue to face a market where affordability is gradually improving, while a historically high proportion of individuals aged 18 to 34 reside with their parents. Nevertheless, among those who decide to establish their independence, an increasing number are opting for homeownership.
Reduced borrowing costs in the spring, despite a rise following the conflict, contributed to an increase in existing-home sales activity. In contrast, new-home sales have declined as the mortgage rate buydowns and price reductions that previously attracted buyers to builders during higher rate periods are losing their effectiveness, and listing prices are stabilizing. Builders are adjusting their operations accordingly, significantly reducing permits and starts, particularly in the South and West, which are regions that usually account for the majority of national construction and have more completely recovered from supply shortages. The national homebuilding deficit is still estimated at around 4 million homes, presenting the most significant opportunities in the Northeast and Midwest, where shortages are most pronounced.
Renters are anticipated to experience ongoing relief until the conclusion of 2026, as a strong multifamily construction pipeline contributes to increased supply and further reduces rents. The Realtor.com rent growth forecast now predicts a 1.2% decrease in 2026. Vacancy rates, which already stood at 7.3% in the first quarter, are projected to finish the year approximately in line with the long-term average of 7.2% recorded from 2013 to 2019.
The continuation of this relief largely hinges on the ability of supply to match rental demand. An increase in rental supply is essential for maintaining this relief. Although multifamily starts in the first quarter were relatively strong, they experienced a significant decline in May. This fluctuation is likely more indicative of temporary variations than a long-term trend, but it merits close observation: if supply keeps pace with or exceeds demand, rents should continue to decrease; however, if construction slows before demand aligns, the relief may either stall or reverse.
Rental Trends & Prices Expected to Continue Their Decline
Renters are anticipated to experience ongoing relief until the conclusion of 2026, as a strong multifamily construction pipeline contributes to increased supply and further reduces rents. The forecast from Realtor.com now predicts a 1.2% decrease in rents for 2026. Vacancy rates, which were already recorded at 7.3% in the first quarter, are projected to finish the year approximately in line with the long-term average of 7.2% observed from 2013 to 2019.
The continuation of this relief is largely contingent upon supply matching rental demand. The addition of more rental units is crucial for maintaining this relief. Although multifamily construction starts in the first quarter were relatively strong, there was a significant decline in May. This fluctuation is likely more indicative of temporary variations rather than a long-term trend, but it merits close observation: if supply keeps pace with or exceeds demand, rents should continue to decrease; conversely, if construction slows before demand is met, the relief may either stall or reverse.
One significant factor to monitor in the latter half of 2026 is the ongoing expansion of private listing networks—properties advertised outside the MLS or search portals, whether on a temporary or permanent basis. Currently, there is scant evidence that these networks are influencing sales or prices; however, their impact may be reflected in inventory levels, as homes could be sold privately prior to being listed on the MLS. At this moment, the more pressing concern lies with home buyers and sellers.
“Keeping listings off the open market changes the equation for everyone involved,” Hale said. “Sellers who go private are trading away visibility and competition among buyers, and that competition is usually what pushes a sale price up. For buyers, it means they aren’t seeing every home or the whole market, making it harder to know what a fair price even looks like. That’s a real cost with real consequences and is something we should be cautious of as the market is starting to find its footing.”
Note: Throughout this release, “real” refers to figures adjusted for inflation, as distinct from “nominal” figures, which reflect raw dollar or percentage changes without that adjustment.