



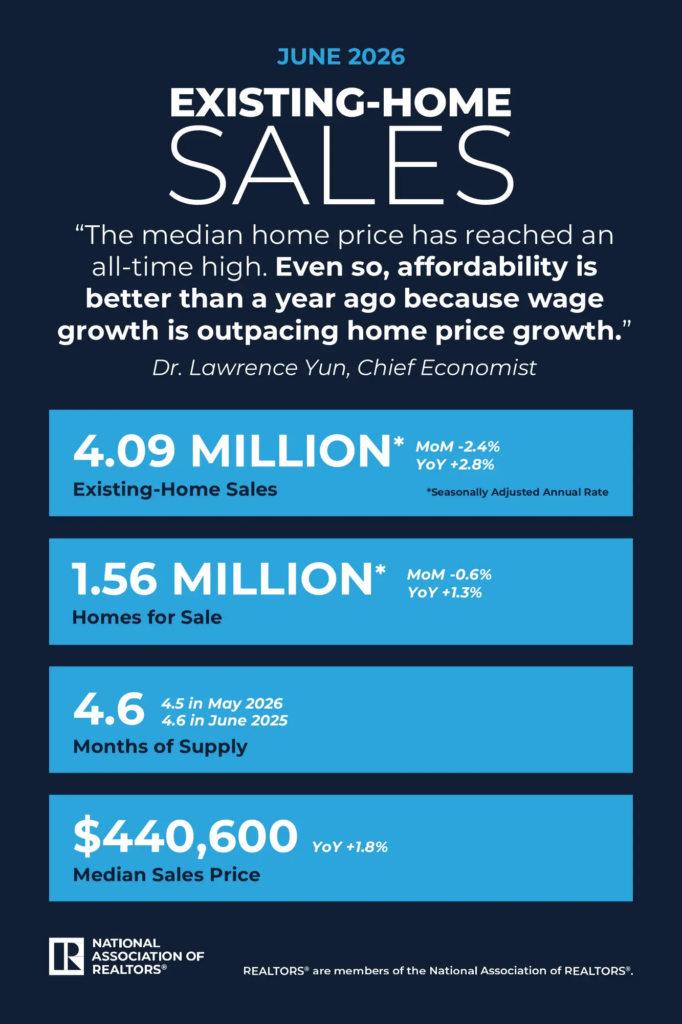
According to the National Association of Realtors (NAR) Existing-Home Sales report, existing-home sales experienced a month-over-month (MoM) decline of 2.4% while showing a year-over-year (YoY) increase of 2.8%. This report offers valuable data regarding home sales, pricing, and inventory to the real estate community, which includes agents, homebuyers, and sellers.
Sales saw a MoM increase in the Northeast, whereas the Midwest, South, and West experienced declines. In contrast, YoY sales improved in the Midwest, South, and West, while remaining unchanged in the Northeast.
“The back-and-forth in monthly home sales activity, driven by mild fluctuations in mortgage rates, shows how sensitive home buyers are to affordability conditions,” said Lawrence Yun, Chief Economist for NAR. “However, job gains—more than half a million since the beginning of the year—will continue to provide support for the housing market.”
National Overview — June 2026
- As reported by Freddie Mac, the average rate for a 30-year fixed mortgage in June has increased from 6.44% to 6.49% in May, while it has decreased from 6.82% compared to the same time last year.
- A MoM decrease of 2.4% in existing-home sales
- A YoY increase of 2.8% in existing-home sales, reaching a seasonally adjusted annual rate of 4.09 million
- The total housing inventory stands at 1.56 million units, reflecting a decrease of 0.6% from May and an increase of 1.3% from June 2025
- There is a 4.6-month supply of unsold inventory, which is an increase from 4.5 months last month and remains unchanged from 4.6 months a year ago
- The median price of existing homes across all types of housing was $440,600
- A 1.8% rise compared to the previous year ($432,700)—marking the 36th consecutive month of YoY price growth
- The Housing Affordability Index has recorded a value of 102.3, an increase from 95.5 one year prior
Overall, affordability improved across all regions YoY:
- Northeast (+4.5%)
- Midwest (+6.2%)
- South (+8.3%)
- West (+8.9%)
Further, a MoM sales decline of 2.4% has resulted in a seasonally adjusted annual rate of 3.73 million, reflecting an increase of 3.3% compared to June 2025. The median home price stands at $446,400, which is an increase of 1.8% from the previous year.
There has also been a Mom sales reduction of 2.7%, leading to a seasonally adjusted annual rate of 360,000. This represents a 2.7% decrease from the same period last year. In conclusion, the median price is currently $380,000, marking an estimated 1.6% increase from June 2025.
“The median home price has reached an all-time high. Even so, affordability is better than a year ago because wage growth is outpacing home price growth,” Yun said. “However, progress on long-term housing affordability could be hampered if inventory growth continues to stall. Without consistent gains in inventory, home prices can accelerate. It is critical to introduce more supply to the market to widen the opportunity for homeownership.”
Overview of Existing-Home Sales by Region — June 2026
Northeast:
- 2.1% increase in sales MoM to an annual rate of 480,000
- Unchanged from June 2025
- $564,800: Median price, up 3.9% from June 2025
Midwest:
- 3.0% decrease in sales MoM to an annual rate of 980,000
- Up 2.1% YoY
- $346,600: Median price, up 2.7% from June 2025
South:
- 3.6% decrease in sales MoM to an annual rate of 1.89 million
- Up 3.8% YoY
- $377,700: Median price, up 0.9% from June 2025
West:
- 1.3% decrease in sales MoM to an annual rate of 740,000
- Up 2.8% YoY
- $633,600: Median price, up 0.9% from June 2025
In summary, the median time on the market for properties is currently 28 days, a decrease from 29 days recorded last month, increasing from 27 days in June 2025. First-time homebuyers also accounted for 33% of sales, a decline from 35% in May, representing an increase from 30% one year ago.
Cash sales represented roughly 25% of transactions, remaining stable compared to last month, signaling a decrease from 29% in June 2025. Individual investors or second-home buyers made up 13% of transactions, down from 14% last month, an additional decrease from 14% one year ago. Distressed sales, which include foreclosures and short sales, constituted 2% of sales, an increase from 1% last month. However, this is a decrease from 3% one year ago.